East 11 th & 12 th Street Development Strategy Community - - PowerPoint PPT Presentation

east 11 th 12 th street development strategy
SMART_READER_LITE
LIVE PREVIEW

East 11 th & 12 th Street Development Strategy Community - - PowerPoint PPT Presentation

REVISED effective 11/18/11 East 11 th & 12 th Street Development Strategy Community Meeting #2 November 15, 2011 1 Tonights Agenda 1. Review of Study Goal and Process 2. Market Analysis Update 3. Infrastructure Analysis Update


slide-1
SLIDE 1

1

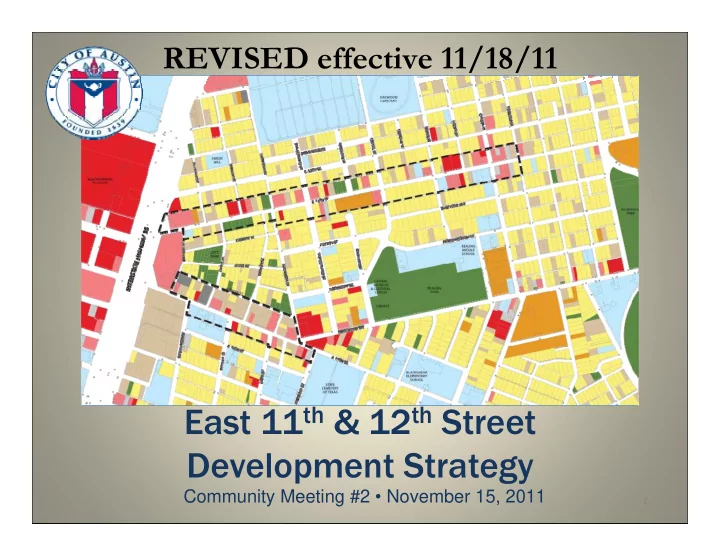
East 11th & 12th Street Development Strategy

Community Meeting #2 • November 15, 2011

REVISED effective 11/18/11

slide-2
SLIDE 2

2

Tonight’s Agenda

1. Review of Study Goal and Process 2. Market Analysis Update 3. Infrastructure Analysis Update 4. Next Steps

slide-3
SLIDE 3

3

Study Goal and Process

Goal: Get Community and City Support for a “Road Map”

  • f Actions to Jump-Start Development in the Corridor

Process 1. Review of Existing Conditions 2. Identify Near-term Opportunities and Constraints 3. Research and Recommend Methods for Moving Forward

  • Who, What, Where, When, Why
slide-4
SLIDE 4

4

Study Priorities

Key Issues identified through stakeholder outreach and Community Meeting #1 (tonight’s issues in bold)

  • Housing Opportunities and Gentrification
  • Neighborhood Retail Opportunities
  • Commercial Development Opportunities
  • Infrastructure Needs
  • Disposition of Public Land
  • Parking Strategy
  • 12th & Chicon
  • Development Regulations and Process
slide-5
SLIDE 5

5

Purpose of Market Analysis

  • Identify near-term opportunities to jumpstart

development

  • Inform expectations for developer interest in

publicly owned parcels

  • Evaluate potential for buildout of enabled

development

  • Assess viability of community-desired uses
  • Identify trends pointing to longer-term needs
slide-6
SLIDE 6

6

“Primary Market Area”

I-35

2010 Population: 6,751 Households: 3,459 Jobs: 2,666

slide-7
SLIDE 7

7

Austin Market is Strong and Growing

  • Austin/Travis County are among the stronger

markets nationally

– Job growth even during Great Recession – Low unemployment (7.4% vs. 9.0% National)

  • Regional growth is expected to continue

– Population growth of 21 percent and – Employment growth of 22 percent by the year 2025.

slide-8
SLIDE 8

8

Total Employment Trends

Source: U.S. Bureau of Labor Statistics U.S. Austin 106,000 108,000 110,000 112,000 114,000 116,000 118,000 120,000 122,000 2000 2001 2002 2003 2004 2005 2006 2007 2008 2009 2010 2011 550 600 650 700 750 800 U.S. Austin *Note: Numbers in Thousands

slide-9
SLIDE 9

9

Unemployment Rate

Source: U.S. Bureau of Labor Statistics

Austin, 7.4% US, 9.0% 0% 1% 2% 3% 4% 5% 6% 7% 8% 9% 10% 2000 2001 2002 2003 2004 2005 2006 2007 2008 2009 2010 2011

slide-10
SLIDE 10

10

Market Area Expected to Grow

  • CAMPO estimates future growth based on local growth

policies, development constraints, anticipated land development projects, and other factors that may influence patterns of future growth.

  • Population projected to increase by 26 percent or

approximately 2,000 people by the year 2025

  • Market Area employment may grow by 150 percent or

4,200 jobs by the year 2025

  • Most growth in “service” industries and “retail” jobs

Source: Capital Area Metropolitan Planning Organization (CAMPO)

slide-11
SLIDE 11

11

Projected Growth in the Market Area

Source: Capital Area Metropolitan Planning Organization

2010 2025 # % Population 7,758 9,771 2,013 26% Households 2,853 3,737 884 31% Total Employment 2,666 6,928 4,262 160% Basic 351 789 438 125% Retail 450 1,781 1,331 296% Professional Services 1,620 4,113 2,493 154% Education 1 245 245 Education 2 2010-2025

slide-12
SLIDE 12

12

Projected Job Growth – 2010-2025

Source: Capital Area Metropolitan Planning Organization

Study Area: 1,532 new jobs (+525%)

slide-13
SLIDE 13

13

Why is CAMPO So Optimistic about the Study Area?

  • Central location near jobs, schools, amenities
  • Favorable zoning/regulations
  • Available and underutilized land
  • Recent growth and increasing property values
slide-14
SLIDE 14

14

Demographic Changes in Study Area

  • Reduction in “child” and “senior” population
  • Reduction of minority population
  • Reduction in “family” households and average

household size

  • Rapidly increasing income levels

Source: U.S. Census

slide-15
SLIDE 15

15

Reduction of Children and Seniors

17 and under 17 and under 18 to 24 18 to 24 25 to 44 25 to 44 45 to 64 45 to 64 65+ 65+ 0% 10% 20% 30% 40% 50% 60% 70% 80% 90% 100% 2000 2010 Source: U.S. Census

slide-16
SLIDE 16

16

White White Black Black Other [1] Other [1]

1,000 2,000 3,000 4,000 5,000 6,000 7,000 8,000 2000 2010

6,588 6,751

Reduction of Minority Population

Source: U.S. Census [1] Includes Asian, American Indian and Alaska Native, Native Hawaiian and Other Pacific Islander, Some Other Race, and Two or More Races.

slide-17
SLIDE 17

17

Reduction of Family Households

Source: U.S. Census

Family Family Non-Family Non-Family 500 1,000 1,500 2,000 2,500 3,000 2000 2010

2,167 3,459

slide-18
SLIDE 18

18

Growth in Income Levels

Source: U.S. Census $37,525 $49,223 $12,326 $20,254 $59,732 $71,103 $24,163 $30,063 $0 $10,000 $20,000 $30,000 $40,000 $50,000 $60,000 $70,000 $80,000 2000-Mean 2009-Mean 2000-Per Capita 2009-Per Capita Market Area Austin

slide-19
SLIDE 19

19

Growth in Income Levels

Market Area Austin

31.2% 64.3% 19.0% 24.4%

Mean Per Capita

Source: U.S. Census

slide-20
SLIDE 20

20

Housing Market Overview

  • The NCCD promotes mixed-use development and

allows multifamily housing

  • Much recent investment in and around area

– In Study Area, Robertson Hill apartments, East Village condos, and many private rehabs/flips – To the south, Saltillo Lofts and similar multifamily – To the north, Mueller Redevelopment

  • City’s Multifamily Report shows more than 1,000

Multi-Family Units have been completed in the 78702 zip code since 2002, several hundred more approved

– Average size ~2 acres, 75 units

slide-21
SLIDE 21

21

For-Sale Housing: Near-Term Challenges

  • Many condominiums built in mid-to late-2000s

throughout City

– Peak of 12K multifamily units under construction in 2008 – Some planned condos converted to rentals due to market issues

  • East Austin condo production and absorption has slowed
  • Financing challenges for new condo projects

– Buyers’ difficulty obtaining mortgages – Construction costs still high, require high prices

  • Competition: Mueller, approved projects and more

conventional housing

slide-22
SLIDE 22

22

Median Home Price Growth in Market Area

Source: austin.housealmanac.com

$206,340 $50,807

$0 $50,000 $100,000 $150,000 $200,000 $250,000 2000 2001 2002 2003 2004 2005 2006 2007 2008 2009

slide-23
SLIDE 23

23

For-Sale Housing: Longer-Term Opportunity

  • Rising home prices due to Market Area advantages

– Proximity to jobs, UT, amenities

  • Continued improvement of area will attract more buyers

– Addition of retail, services will enhance market

  • Market “corrections” should swing back

– Reduce competition from foreclosed properties – Relax financing constraints

slide-24
SLIDE 24

24

Rental Housing: Near-Term Opportunity

  • Regional apartment market is very strong

– Now 95% occupied, up 5% despite 4% more units since 2009 – Average rents have increased 12% in 2 years

  • Developers are responding to this strong market

– 6,500 multifamily units under construction Citywide in 3Q11, with another 8,700 approved

  • Study Area has “Downtown” advantages

– Proximity to jobs, UT, entertainment, amenities – Robertson Hill project achieves rents 50+% higher than regional average ($1.50 - $1.90/SF vs. $1.03)

slide-25
SLIDE 25

25

Why Support Apartments?

  • Apartments can jumpstart development

– Financing is available – Demand is strong and expected to continue – Relatively easy to achieve mixed-use with apartments

  • Apartment tenants can increase retail support

– Robertson Hill charges ~$2,000/month for a 2BR unit – To afford this rent, typical households earn ~$80,000/yr – Average household income in Study Area ~$50,000

slide-26
SLIDE 26

26

Affordable Housing Supply

  • Market Area does have much affordable housing

– ZIP Code 78702 has 1,761 total affordable housing units*

  • Includes Austin Affordable Housing Corp, AHFC, HACA and

HATC Public Housing, Project Based and 202 Section 8, and LIHTC units.

– These units comprise 22%* of all housing units in the ZIP Code, while City overall has only 6% “affordable housing”

*EPS has adjusted the figures after noting a technical error regarding ZIP Code boundaries.

slide-27
SLIDE 27

27

slide-28
SLIDE 28

28

Market Area Still Has Affordable Housing Needs

  • Local market generally is growing more expensive, not

more affordable

  • Market niches needing affordable housing

– In-place Resident Needs – 46% of households in the Study Area earn <50% of Citywide AMI ($74,000) – Family housing – “family” households dropped from 60% to 46% since 2000 – Senior housing – percent of population over age 65 dropped from 12% to 7% since 2000

  • Additional affordable housing can help these populations

stay in the neighborhood

slide-29
SLIDE 29

29

Housing Market Conclusions

1. Apartments

– Strongest near-term market support – Compatible with regulations supporting mixed-use

2. Condos and Townhomes

– Eventual market support, but near-term challenges – Townhomes can provide family housing at lower price points – Townhomes don’t maximize density and economic impact

3. Live/Work Lofts

– Appeals to creative industries – Addresses both housing and employment growth

4. Affordable housing

– Especially for families, seniors – Some can be incorporated into mixed-income projects

slide-30
SLIDE 30

30

Retail Market Basics

  • Plans encourage retail, particularly in mixed-use

development

  • Existing retail supply is minimal

– Few options for basic goods and services on E. 12th St. – E. 11th St. has more dining options and local shops

  • Demand for retail has grown as local incomes increase

– Aggregate local income up 68% since 2000 – Future population and job growth will enhance retail prospects

slide-31
SLIDE 31

31

Retail Market Basics

  • Competition:

– General Merchandise:

  • Hancock Center/Capital Plaza/Mueller area

– Local Goods and Services:

  • East 7th Street, Mueller, Airport Blvd, Manor Rd.

– Entertainment/Dining:

  • Downtown, S. Congress, Lamar, UT Area

Local Need: Grocery and neighborhood services

slide-32
SLIDE 32

32

Grocery Store Supply and Demand

Source: U.S. 2000 and 2010 Census; Bureau of Labor Statistics; CAMPO

2025 Households 3,737 2009 Mean Household Income in Study Area $49,223 [1] Total Income in Study Area $183,945,802 Percent spent on food at home for HH 7.6% making $40,000-$49,999 before taxes Portion of income spent of food at home $13,979,881 Size of grocery store ($500/sq ft) If 20% Capture 5,600 sq ft If 100% Capture 28,000 sq ft Size of other grocery stores: Farm to Market 3,200 sq ft Wheatville Co-op 14,000 sq ft H-E-B 53,500 sq ft Whole Foods 80,000 sq ft

[1] Source: U.S. Census Bureau, 2005-2009 American Community Survey

(2009$)

slide-33
SLIDE 33

33

Market Area Demand

  • vs. Enabled Retail Space

2009 Mean Household Income in Study Area $49,223 2025 Number of Households 3,737 Total Income in Study Area $183,945,802 Typical Percent of Income Spent on Retail for Households 22% making $40,000-$49,000 in 2009 Amount of Money Spent on Retail by $40,618,246 Households in the Study Area Total Square Footage Supported by Study Area 162,000 Households($250/sq ft) (100%) Amount Captured by Local Retail (25%) $10,154,562 Supportable Retail Square Footage ($250/sq ft) (25%) 41,000 Retail Capacity with All Buildings along 12th Street 170,000 Containing Ground Floor Retail (2009$) Future (2009$)

slide-34
SLIDE 34

34

Retail Conclusions

  • Growing demand/support for retail in the area

– Major increase in local purchasing power

  • Need groceries and basic neighborhood services

– Small-scale grocery can serve as catalyst for other retail, but may need financing support

  • E. 11th Street dining can build on culture and

entertainment

  • Other retail types may be longer-term prospects

– Clothing, home furnishings, etc.

  • Have reasonable ground floor retail requirements

– Focus on major intersections

slide-35
SLIDE 35

35

Office Market Basics

  • Plans encourage commercial development,

including mixed-use

  • Area is well located for future job growth

– Downtown, Capitol, UT, Medical Center

  • Recent investment in area

– Street-Jones/Snell Bldg tenants, professional services

  • Area has potential for continued growth in

smaller employers

slide-36
SLIDE 36

36

Small Businesses are Major Job-Creators

5,000 10,000 15,000 20,000 25,000 30,000 35,000 40,000 45,000 1999 2009

Businesses in County with <50 employees 50+

Source: U.S. Census Bureau Business Patterns

Businesses in County with <50 employees 50+

slide-37
SLIDE 37

37

East Austin Achieves Low Office Rents

Rental Rate (Class B)

CBD East Austin $14.00 $16.00 $18.00 $20.00 $22.00 $24.00 $26.00 Q1 Q2 Q3 Q4 Q1 Q2 Q3 Q4 Q1 Q2 Q3 Q4 Q1 Q2 Q3 2008 2009 2010 2011

Source: CB Richard Ellis

slide-38
SLIDE 38

38

East Austin Has High Office Vacancy

Vacancy Rate CBD East Austin 10% 15% 20% 25% 30% 35% 40% 45% 50% Q1 Q2 Q3 Q4 Q1 Q2 Q3 Q4 Q1 Q2 Q3 Q4 Q1 Q2 Q3 2008 2009 2010 2011

Source: CB Richard Ellis

slide-39
SLIDE 39

39

Office Market Analysis

  • Competition – Downtown, Mueller, Capitol Complex
  • CAMPO projects ~3,000 more “basic” and “service”

jobs in local market area by 2025

– Would equate to 750K-1.0M SF of new commercial space – Hard to imagine given land constraints and current market conditions, but can be regarded as a promising indicator

  • Opportunities

– Not a major office center, but smaller professional services – Need for affordable space – support current tenants

slide-40
SLIDE 40

40

“Takeaways” from Market Research

  • Apartments are strongest near-term opportunity

– For-sale condos and townhomes are longer-term – Despite many affordable units, still have needs

  • Retail can be enhanced through added residents

– Focus on neighborhood goods and services on 12th

  • Identify funding resources to support grocery store

– Continue dining/specialty retail on 11th – Have reasonable expectations about supportable retail square footage

  • Market the area as a location for small employers

– Professional services, consumer services, creative industries – Live/work lofts would address both housing demand and job growth

  • Incorporate these concepts into Development Strategies

– Property disposition, regulatory clarifications, marketing efforts, etc.

slide-41
SLIDE 41

41

Infrastructure Assessment Goals

  • Evaluate existing conditions
  • Assess adequacy of current systems to support

future development

  • Identify opportunities to facilitate development
slide-42
SLIDE 42

42

Future Development Assumptions

  • Identified vacant and “underutilized” sites along

corridor

– All vacant sites get developed at 80% of maximum buildout under NCCD – “Underutilized” sites get built out at 50% of maximum density (adjustment for probability)

  • Sums to ~680K square feet of development on

13 acres on E. 12th Street

slide-43
SLIDE 43

43

Insert Map

slide-44
SLIDE 44

44

Infrastructure Analysis

  • Looked at the existing infrastructure in terms of

capacity/condition

  • Interviewed staff on existing issues/future

projects/development process

  • Looked at projected densities and probable

development scenarios

  • Development potential versus other parts of city
slide-45
SLIDE 45

45

Electrical & Telecommunications

  • Major transmission and distribution lines along the

majority of 12th Street

  • Multiple additional communication services using

the poles

  • System is reliable and has feed from multiple sub-

stations which provides backup service feeds.

  • More than adequate for future growth
slide-46
SLIDE 46

46

Electrical & Telecommunications

slide-47
SLIDE 47

47

Electrical & Telecommunications

Can we put the overhead system underground?

  • The challenges:

– ROW along 12th varies from 60’ – 70’. Challenges with multiple underground utilities. Transmission line requires 30’ easement. – Services to existing structures may require upgrades by landowner – Cannot be funded by AE, must be developers or City CIP – Estimate $2,000,000 to $6,000,000.

  • Other options to reduce visual impact?

– Relocate to alleys? – Underground telecomm only? – Remove/Consolidate some poles?

slide-48
SLIDE 48

48

Electrical & Telecommunications

slide-49
SLIDE 49

49

Communication Lines Removal

slide-50
SLIDE 50

50

Austin Water Utility

Water:

– 12” water line on 12th connects to 24” mains at Navasota and Airport – System better than in most of downtown and urban areas – Should be adequate to support new development, including fire flows – May need limited upgrades near certain cross-streets that only have 6” lines or smaller

slide-51
SLIDE 51

51

slide-52
SLIDE 52

52

Austin Water Utility

Wastewater:

– Area between I-35 and San Bernard has older 6” and 8” lines. COA maintenance records show lines are functioning and have additional capacity available. – Area between Chicon and Poquito has older 6” wastewater line within the alley and will need upgrade with new development – Other areas served by upgraded system.

slide-53
SLIDE 53

53

slide-54
SLIDE 54

54

Austin Water Utility

Planning and Approval Process

– Service Extension Process. Start early in planning of a new development. – The planning and operations process of AWU is set up to respond to development applications/demand on system – AWU has approximately $10 million a year to fund water and wastewater failures and upgrades – There are current changes occurring in the plumbing code to allow for grey water systems. i.e. reduce ww flows

slide-55
SLIDE 55

55

Austin Water Utility

How do we estimate future demands?

– Use of a Living Unit Equivalent (LUE) – Estimate for build-out projects in Area 1 is 300 LUES – Actual permitted project, one block long required 22 LUES, although planning estimates may be 75 LUES – Future changes in technology and plumbing code could reduce the water and wastewater usage.

slide-56
SLIDE 56

56

Austin Water Utility

Water and Wastewater Summary

– Future projects within the 12th Street corridor should have adequate water and wastewater service. – Development process in the City of Austin can require

  • ff-site upgrades but no immediate major ones

identified for this area – No record within the AWU of SER applications. – At some point in the future the older 6” and 8” in the western section of 12th will most likely need replacement.

slide-57
SLIDE 57

57

slide-58
SLIDE 58

58

Stormwater

  • 12th Street west of San Bernard is in Waller Creek

Watershed, and has ample downstream capacity for new development

  • East of San Bernard, 12th Street is in the Boggy Creek

Watershed, which has undersized downstream system

  • Current storm water flows to streets and to trunk line

inlet system. No flooding problems reported within study area according to COA records.

  • New projects that increase impervious surface may need
  • n-site stormwater detention, off-site improvements, or

may receive waiver under certain conditions

slide-59
SLIDE 59

59

Development Process

slide-60
SLIDE 60

60

Streets and Sidewalks

  • 11th and 12th Street roadways generally appear

adequate in size and quality

– No significant upgrades are required to address current deficiencies or enable new capacity

  • Sidewalks (some ADA issues) are present and

continuous throughout Study Area corridor

– Could improve “look and feel” of streetscape, but no actual capacity issues observed

slide-61
SLIDE 61

61

“Takeaways” from Infrastructure Assessment

  • Infrastructure adequacy is not a major constraint for

future projects that may come online

  • Upgrades for downstream stormwater and wastewater

may be required for full buildout, but this will be done when the demand warrants

  • Streetscape improvements including some buried
  • verhead utilities, ADA and landscape would improve

“look and feel,” encourage development

  • Hard to justify wholesale reconstruction of streets due to

infrastructure need rather than as corridor enhancement

slide-62
SLIDE 62

62

Next Priorities (“At a Minimum”)

  • Create strategies for disposition of public land
  • Explore opportunities for catalytic project and other

interventions at 12th & Chicon

  • Explore opportunities for incentives for desired

businesses, if necessary for feasibility

  • Assess potential benefits of infrastructure improvements

and identify CIP possibilities for long-term projects

  • Explore opportunities for shared parking facilities
  • Recommend approaches to address gentrification
  • Recommend improvements to development process and

clarification of regulations

slide-63
SLIDE 63

63

Upcoming Communications Plan

  • Release draft strategies in mid-December

– To be posted on Speak Up Austin (speakupaustin.org)

  • Present draft strategies publicly on January 9, 2012

– Open house/presentation coordinated with URB meeting

  • Present final strategies to City Council in late

January

– Reflecting refinements based on earlier feedback

slide-64
SLIDE 64

64

THANK YOU.

CONTACT US EMAIL: NHCD@austintexas.gov PHONE: Sandra Harkins - 512.974.3100 WEB: http://www.ci.austin.tx.us/ahfc/comm_revital.htm