
SLIDE 1
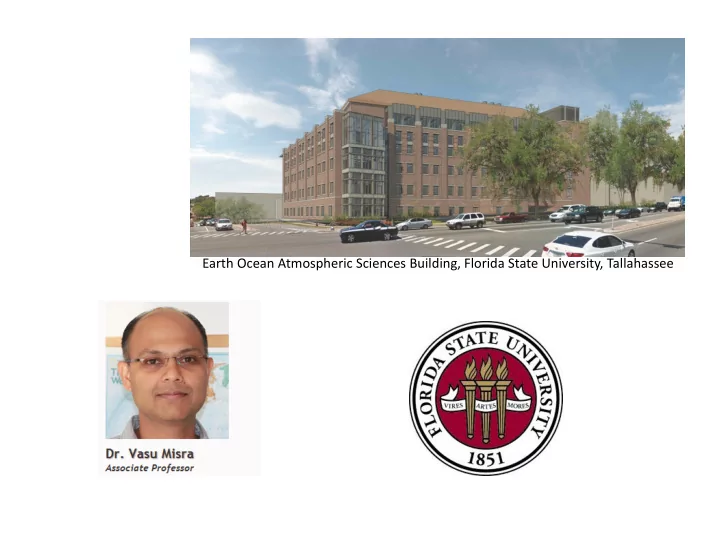
Earth Ocean Atmospheric Sciences Building, Florida State University, Tallahassee
Earth Ocean Atmospheric Sciences Building, Florida State University, - - PowerPoint PPT Presentation
Earth Ocean Atmospheric Sciences Building, Florida State University, Tallahassee Urban water supply and demand in a changing demography The three states account for 27% (81 million) of the current US population They account for 48% of US
Earth Ocean Atmospheric Sciences Building, Florida State University, Tallahassee
economy; rapid growth in first and second generation immigrants)
Using HURDAT from 1950-2007 The clusters are based on storm position and time Storms in clusters 1 and 2 form farther north than 3 and 4 Storms in clusters 1 and 3 form farther east than 2 and 4 Cluster 1 has pronounced northward track Cluster 4 has pronounced westward track Cluster 2 form almost exclusively in GoM Clusters analysis of North Atlantic Tropical Cyclones From Kossin et al. (2010)
1980’s
Atlantic, post-1980 there is proportionately more cluster 3 and 4 storms compared to clusters 1 and 2.
baroclinically initiated or enhanced storms are decreasing post 1980.
1977) orbiting satellite observations Kossin et al. 2010
(or a weak cooling SST trend)
trends and the overall trend is positive but significantly weaker than those found in clusters 3 and 4. Kossin et al. 2010
From SECC 2015
Humidity impact on differences in Tmax and Tmin