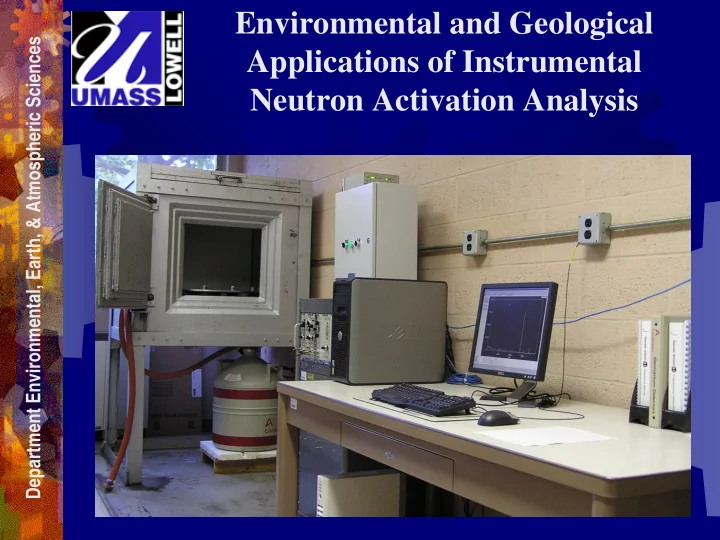
SLIDE 1
Environmental and Geological Applications of Instrumental Neutron Activation Analysis
Department Environmental, Earth, & Atmospheric Sciences
SLIDE 2
Department Environmental, Earth, & Atmospheric Sciences
“Instrumental Neutron Activation Analysis is an obsolete analytical technique.” NSF program director Yes, No, Maybe?
SLIDE 3
Department Environmental, Earth, & Atmospheric Sciences
Principles of Instrumental Neutron Activation Analysis
SLIDE 4
The n–gamma Reaction The basic reaction for INAA
Example: 58Fe + 1n 59Fe + Beta- + gamma rays Gamma ray energies = 142.4, 1099.2, 1291.6 KeV
Department Environmental, Earth, & Atmospheric Sciences
SLIDE 5
UML 1 Mw Research Reactor The Neutron Source
Different neutron energies are used for different types of experiments. Department Environmental, Earth, & Atmospheric Sciences
SLIDE 6
Department Environmental, Earth, & Atmospheric Sciences
Data acquisition flow sheet
SLIDE 7
UML INAA Lab
Gamma ray spectrum for a multi element sample
Department Environmental, Earth, & Atmospheric Sciences
SLIDE 8 Department Environmental, Earth, & Atmospheric Sciences
INAA Analysis Scheme
- Irradiate sample (thermal neutrons)
- Count sample 5 to 10 days after irradiation
to determine short-lived isotopes
- Count sample 4 to 8 weeks after irradiation
to determine long-lived isotopes
- Calculate concentrations after applying
decay, interference, fluence, and fission- product corrections.
SLIDE 9
Sensitivity (pg) Elements
1 Dy, Eu 1-10 In, Lu, Mn 10-100 Au, Ho, Ir, Re, Sm, Lu 100-1E3 Ag, Ar, As, Br, Cl, Co, Cs, Cu, Er, Ga, Hf, I, La,
Sb, Sc, Se, Ta, Tb, Th, Tm, U, W, Yb
1E3-1E4 Al, Ba, Cd, Ce, Cr, Hg, Kr, Gd, Ge, Mo, Na, Nd,
Ni, Os, Pd, Rb, Rh, Ru, Sr, Te, Zn, Zr
1E4-1E5 Bi, Ca, K, Mg, P, Pt, Si, Sn, Ti, Tl, Xe, Y 1E5-1E6 F, Fe, Nb, Ne 1E7 Pb, S Elements routinely analyzed in environmental and geological samples at UML. Department Environmental, Earth, & Atmospheric Sciences
SLIDE 10 Advantages of INAA
Can analyze a large number of elements simultaneously Very low detection limits for many elements Small sample sizes (1 – 200 mg) No chemical preparation
- Nondestructive. The material is available for other
analytical techniques Relatively low entry cost (~$60,000) compared to other high sensitivity analytical methods
Department Environmental, Earth, & Atmospheric Sciences
Major Disadvantage of INAA compared to ICP-MS
Can’t analyze for all elements of interest. Partner with X- ray fluorescence spectrometry (XRF)
SLIDE 11
Department Environmental, Earth, & Atmospheric Sciences
INA XRF INA XRF INA XRF INA XRF INA XRF Na Na Cr Cr Rb Rb Nd Nd Ta Mg Mn Mn Sr Sr Sm W Al Fe Fe Y Eu Au Si Co Co Zr Zr Gd Pb P Ni Ni Nb Tb Th Th K K Cu Sb Ho U Ca Zn Zn Cs Tm Sc Ge Ba Ba Yb Ti As La La Lu V Se Ce Ce Hf
Elements analyzed by combined INA-XRF Analysis
*Bold Italics – preferred method
SLIDE 12
“I am a little concerned about the quality of some of the trace element data but this is a general criticism of the way geochemists are doing ICP-MS. Personally, I don't think REE data at +/- 5-10% are "fit to purpose" but this is what many ICP-MS labs are producing. Certainly such data are of inferior quality to the ID and INAA REE data we laboured long and hard to produce 20 years ago. One can do 1-2% RSD on REE by ICP-MS but you need to understand, monitor and correct all the potential pitfalls.” Comments from a Lithos review.
So, Is INAA Obsolete?
No!
For many applications it is the method of choice or is a competitive choice with respect to ICP-MS.
SLIDE 13
Applications of INAA at UML
Trace element analysis - rocks and minerals Sediment and soil compositions Partitioning of metals between phases in coal Origin of archaeological artifacts Tephra correlation for archaeological studies Trace metals in nanotech materials Forensics Chemistry of atmospheric aerosols Distribution of metals in tree rings Chemistry of grasses
Department Environmental, Earth, & Atmospheric Sciences
SLIDE 14 Chemistry of Atmospheric Aerosols Deposition of Aerosols Onto Mass Bays
Location of aerosol sampling sites – Nahant and Truro
Department Environmental, Earth, & Atmospheric Sciences
Co-Investigators
- D. Golomb, UML
- D. Ryan, UML
- J. Underhill, UML
- S. Zemba,
Cambridge Environmental, Inc.
SLIDE 15 Wet & Dry Collectors Dichot sampler Field site
Aerosol Sampling Location, Truro
Department Environmental, Earth, & Atmospheric Sciences (Photographs courtesy of
SLIDE 16 Dry and wet total deposition amounts were calculated for both sites. Atmospheric aerosols were major contributors of Fe, Mn, Zn, and Cd to Mass
- Bays. For most metals dry
deposition was greater at Nahant presumably because of the close proximity of the site to Metropolitan Boston. Factor analysis was used to identify and apportion the sources of the aerosols.
Department Environmental, Earth, & Atmospheric Sciences
SLIDE 17 Department Environmental, Earth, & Atmospheric Sciences
Rotated Factor Loadings for Nahant Dry Deposition Element F1 F2 F3 F4 Communality As 0.84 75.3 Ce 0.91 87.8 Fe 0.88 89.1 La 0.86 86.9 Sc 0.94 93.9 Sm 0.96 94.7 Cd 0.83 80.5 Co 0.80 70.0 Cr 0.82 86.2 Cu 0.76 72.4 Ni 0.50 0.49 51.5 Al 0.60 46.3 Mn 0.46 46.8 Pb 0.72 52.1 Sb 0.70 71.3 Se 0.66 46.9 Zn 0.40 44.7 %Variance 46.6 18.9 11.0 6.1 82.7 F1 – automotive & crustal, F2 – oil combustion, F3 – soil, F4 – coal combustion & incineration.
SLIDE 18 Department Environmental, Earth, & Atmospheric Sciences
Can we tell if F1 represents a crustal or automotive source? Yes! The value of REE geochemistry
- Chondrite-normalized patterns are distinctive
for different sources
meteorite type representative of the composition of the earth’s mantle) normalization to remove the variability in elemental abundances (Oddo-Harkins rule)
SLIDE 19
Department Environmental, Earth, & Atmospheric Sciences
F1 is a crustal, not an automotive source
SLIDE 20
Department Environmental, Earth, & Atmospheric Sciences
Tree-ring width and isotopic records showing industrially induced physiological stress and recovery of trees in the northeastern USA: Carbon-cycle implications Co-Investigators
Long Li, Zicheng Yu, Gray Bebout, T. Stretton, Andrew Allen, Peter Passaris Lehigh University
SLIDE 21
Department Environmental, Earth, & Atmospheric Sciences
Between 1898 and 1980 New Jersey Zinc had several operating smelters at Palmerton, PA. Electrostatic precipitators were installed in 1953.
SLIDE 22
Department Environmental, Earth, & Atmospheric Sciences
Metal variations in tree-ring cores
SLIDE 23
Department Environmental, Earth, & Atmospheric Sciences
Time – concentration plots for As, Se, and Zn showing sensitivity and error associated with INAA measurements.
SLIDE 24 Collecting sap the
Forensics – Source of the Maple Syrup
Department Environmental, Earth, & Atmospheric Sciences
SLIDE 25
Collecting sap the modern way. Plastic barrels and polyethylene tubing.
Department Environmental, Earth, & Atmospheric Sciences
SLIDE 26
Transferring sap to the sugar house
Department Environmental, Earth, & Atmospheric Sciences
SLIDE 27
Sap holding vats
Department Environmental, Earth, & Atmospheric Sciences
SLIDE 28
Syrup production line Main boiler Secondary boiler Finish boiler
Boiling down the sap
Department Environmental, Earth, & Atmospheric Sciences
SLIDE 29
Quebec Newton Winsor Parker Gale Zn/Cr 11.6 13.9 18.5 61 88 Ba/Sr 0.37 0.59 0.18 0.76 1.29 Rb/Cs 419 642 363 433 175 Sc 0.030 0.010 0.009 0.004 0.006 Cr 1.67 0.67 0.71 0.83 0.87 Co 0.119 0.094 0.064 0.073 0.057 Zn 19.4 9.3 13.1 50.6 76.3 Rb 9.0 7.5 3.1 10.2 15.7 Sr 17.5 28.6 13.7 10.7 8.3 As 0.016 0.029 0.014 0.022 0.010 Sb 0.009 0.018 0.010 0.034 0.010 Se 8.72 ppb As/Sb 1.91 1.59 1.50 0.64 2.24
Concentrations (ppm) and ratios of trace metals in Maple Syrup Department Environmental, Earth, & Atmospheric Sciences
SLIDE 30 Department Environmental, Earth, & Atmospheric Sciences
Element Carbon Black Fullerene Nano TiO2 CNT Silica Nano alumina Fe 25.9 11.7 24.1 2441 450 18.6 ppm Sc 0.002 0.003 4.88 nd 0.200 0.028 ppm Cr 0.303 0.099 2.18 536 1.68 0.714 ppm Co 0.015 0.024 0.43 19582 0.30 0.030 ppm Ni 0.3 0.4 nd 317 64 0.2 ppm Zn 8.26 4.15 32.8 1202 6.45 37.5 ppm Ba nd 0.89 52.4 nd 14.8 nd ppm Sr 6.0 nd nd nd 9.7 nd ppm Ce 4.79 3.91 1.56 nd 4.60 3.36 ppm Zr nd nd 13743 1305 32.2 134 ppm Ta 0.010 0.017 61.9 nd 0.048 0.008 ppm As 0.050 0.010 16.3 0.58 0.212 0.022 ppm Mo nd nd 1.6 415 nd nd ppm Sb 0.020 0.002 321 16.27 0.089 1.23 ppm W 0.030 0.004 11.96 0.46 0.034 27.9 ppm Au 47.5 0.03 99.7 1.29 nd nd ppb Se nd 0.66 nd nd 9.5 23.5 ppb
Trace metals in nanotech materials – Respirable particles
SLIDE 31
Department Environmental, Earth, & Atmospheric Sciences
Serengeti burning and animal behavior – chemistry of grasses
Collaborative project with S. Eby, Syracuse University
SLIDE 32
Department Environmental, Earth, & Atmospheric Sciences
Location map for Tanzania National Parks
SLIDE 33
Department Environmental, Earth, & Atmospheric Sciences
SLIDE 34
SLIDE 35
Prey
SLIDE 36
SLIDE 37
SLIDE 38
Predators
SLIDE 39
SLIDE 40
SLIDE 41
Fire management plan – controlled burning
Department Environmental, Earth, & Atmospheric Sciences
SLIDE 42
Department Environmental, Earth, & Atmospheric Sciences
Animals rapidly move to burned areas – why?
SLIDE 43
Department Environmental, Earth, & Atmospheric Sciences
Grazers move into burned areas because:
Better visibility – longer sight lines for seeing predators Fewer insects Change in nutrient content of grasses Nutrients in ash Other
SLIDE 44
Department Environmental, Earth, & Atmospheric Sciences
SLIDE 45
Department Environmental, Earth, & Atmospheric Sciences Change in elemental concentrations in grasses before and after an area is burned. In most cases elemental concentrations increase after burning. The notable exception is Cr.
SLIDE 46 Department Environmental, Earth, & Atmospheric Sciences
First ever REE concentrations determined for Serengeti grasses. Concentrations are in the range 1000 to 10 nanograms. REE patterns reflect REE concentrations
weathered volcanic ash.
SLIDE 47
Department Environmental, Earth, & Atmospheric Sciences
That’s All Folks!