july 9 10 2020 analysis of success criteria for pos5 in
play

July 9-10, 2020 Analysis of Success Criteria for POS5 in OPR-1000 - PDF document

Transactions of the Korean Nuclear Society Virtual Spring Meeting July 9-10, 2020 Analysis of Success Criteria for POS5 in OPR-1000 using MARS-KS Dohun Kwon, Eojin Jeon, Gyunyoung Heo * Kyung Hee University, Yongin-si, Gyeongi-do, 17104, Korea *


  1. Transactions of the Korean Nuclear Society Virtual Spring Meeting July 9-10, 2020 Analysis of Success Criteria for POS5 in OPR-1000 using MARS-KS Dohun Kwon, Eojin Jeon, Gyunyoung Heo * Kyung Hee University, Yongin-si, Gyeongi-do, 17104, Korea * Corresponding author: gheo@khu.ac.kr 1. Introduction This study was carried out as a part of the 'Development of Multi-unit PSA Regulatory Verification Technology' project, and it would introduce the analysis of success criteria regarding operator action time for Plant Operating State(POS) 5, aiming for Low Power and Shutdown(LPSD) PSA. At the POS5, the coolant inventory is maintained at the mid-loop level of the hot legs, and there is not much quantity that can be filled by injection of coolant because of the open man-ways of the steam generators for the installation of the nozzle dam [1]. It is well known that operator actions to return the functionality of shutdown cooling when it fails are extremely important [2]. 
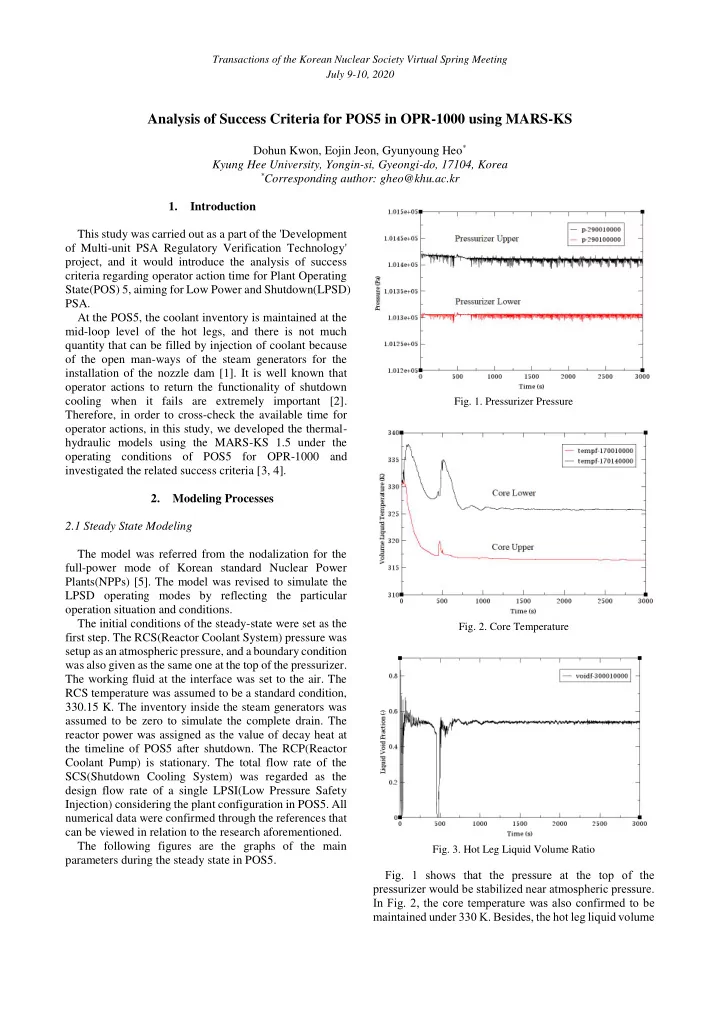
Fig. 1. Pressurizer Pressure Therefore, in order to cross-check the available time for operator actions, in this study, we developed the thermal- hydraulic models using the MARS-KS 1.5 under the operating conditions of POS5 for OPR-1000 and investigated the related success criteria [3, 4]. 2. Modeling Processes 2.1 Steady State Modeling The model was referred from the nodalization for the full-power mode of Korean standard Nuclear Power Plants(NPPs) [5]. The model was revised to simulate the LPSD operating modes by reflecting the particular operation situation and conditions. The initial conditions of the steady-state were set as the Fig. 2. Core Temperature first step. The RCS(Reactor Coolant System) pressure was setup as an atmospheric pressure, and a boundary condition was also given as the same one at the top of the pressurizer. The working fluid at the interface was set to the air. The RCS temperature was assumed to be a standard condition, 330.15 K. The inventory inside the steam generators was assumed to be zero to simulate the complete drain. The reactor power was assigned as the value of decay heat at the timeline of POS5 after shutdown. The RCP(Reactor Coolant Pump) is stationary. The total flow rate of the SCS(Shutdown Cooling System) was regarded as the design flow rate of a single LPSI(Low Pressure Safety Injection) considering the plant configuration in POS5. All numerical data were confirmed through the references that can be viewed in relation to the research aforementioned. The following figures are the graphs of the main Fig. 3. Hot Leg Liquid Volume Ratio parameters during the steady state in POS5. Fig. 1 shows that the pressure at the top of the pressurizer would be stabilized near atmospheric pressure. In Fig. 2, the core temperature was also confirmed to be maintained under 330 K. Besides, the hot leg liquid volume

  2. Transactions of the Korean Nuclear Society Virtual Spring Meeting July 9-10, 2020 ratio was found to be stabilized near 0.5. In conclusion, the 3. Simulation Results steady state was well established upon the above phenomenological results. 3.1 SO/SN Results 2.2 Transient Analysis Fig. 4 and Fig. 5 show the variation of core level and cladding temperature in case of SO or SN over time. The initiating events for this study include: RCS Over- draining due to SCS(SO), Low level of RCS due to SCS(SN), Station Blackout(SBO) after Loss of Offsite Power (LOOP), Recoverable loss of SCS(S1), Unrecoverable loss of SCS(S2), Recoverable LOCA(Loss of Coolant Accident) due to SCS(HL), and Unrecoverable LOCA due to SCS(JL). Total 8 initiating events have been reviewed in terms of their similarity of sequences and divided into four groups, SO/SN, S1/S2, HL/JL, SBO after LOOP. We also developed and analyzed the models turned for representative ‘OK’ sequences of each group’ s event tree. For all modeling, it was assumed that the success criteria for the redundant systems and the available time for Fig. 4. SO/SN Core Level operator actions would be the same as the data that can be referred from plant utility’s information. 2.2.1 SO/SN Event SO or SN are the accidents where the level in the hot leg is drained lower than the mid-level of a leg. At this time, it is assumed that the hot leg level ratio gets decreased down to 0.3. The event sequence follows (1) initiating event, (2) failure of inventory makeup, and (3) success of feed by at least one of HPSI(High Pressure Safety Injection), LPSI, or CVCS(Chemical and Volume Control System). In this study, CVCS was assumed to operate due to conservatism. 2.2.2 S1/S2 Event Fig. 5. SO/SN Cladding Temperature S1 or S2 are the accidents when the residual heat removal function stops. The event sequence follows (1) When SO or SN occurs, SCS fails to work due to the initiating event, (2) failure of restoring SCS, and (3) failure of inventory makeup, causing core level decreased success of feed by at least one of HPSI, LPSI, or CVCS. and cladding temperature increased. CVCS then starts by CVCS was also assumed to operate due to conservatism. an operator within an available time. As a result, the cladding temperature is recovered to a safe state. 2.2.3 HL/JL Event HL or JL occurs when there is leak in an RCS or the others. The event sequence follows (1) initiating event, (2) success of LOCA isolation, and (3) success of SCS startup. 2.2.4 SBO after the LOOP Event SBO happens when all electrical power sources from inside (i.e. LOOP) and outside are cut off. The event sequence follows (1) initiating event, (2) failures of supply electrical power from ACC(Alternate AC), and (3) success of offsite power recovery, and (4) success of feed by HPSI or LPSI. In this case, the availability of CVCS is excluded.

  3. Transactions of the Korean Nuclear Society Virtual Spring Meeting July 9-10, 2020 3.2 S1/S2 Results Fig. 6 and Fig. 7 show the variation of core level and cladding temperature in case of S1 or S2 over time. Fig. 8. HL/JL Core Level Fig. 6. S1/S2 Core Level Fig. 9. HL/JL Cladding Temperature Fig. 7. S1/S2 Cladding Temperature When S1 or S2 occurs, SCS fails to work due to the failure of restoring SCS, causing core level decreased and cladding temperature increased. CVCS then starts by an operator within an available time. As a result, the cladding temperature is recovered to a safe state. SN/SO and S1/S2 has the same criteria in terms of operator’s available time (about 10,000 seconds) after the failure of inventory makeup and restoring SCS, Fig. 10. HL/JL Mass Flow Rate in Broken Part respectively. Therefore, the patterns of SN/SO and S1/S2 show similar ones. When HL or JL occurs, reactor coolant leaks through a broken part in Fig. 10, causing core level decreased and cladding temperature increased. After the accident, HPSI 3.3 HL/JL Results starts up by an operator, which is the success criteria of isolating of LOCA location and making up inventory. In Fig. 8 and Fig. 9 show the variation of core level and this case, HPSI is used due to HL/JL usually occurs in near cladding temperature in case of HL or JL over time. the places where CVCS and SCS are connected. Comparing to other groups, the injection starts earlier so the cladding temperature is not increased so much. Obviously, the cladding temperature is recovered to a safe state.

  4. Transactions of the Korean Nuclear Society Virtual Spring Meeting July 9-10, 2020 3.4 SBO after LOOP Results Acknowledgement Fig. 11 and Fig. 12 show the variation of core level and This work was supported by the Nuclear Safety cladding temperature after SBO over time. Research Program through the Korea Foundation Of Nuclear Safety (KOFONS), using the financial resource granted by the Nuclear Safety and Security Commission(NSSC) of the Republic of Korea (No. 1705001). REFERENCE [1] Y. S. Son, Thermal-Hydraulic Accident Analysis During Low Power/Shutdown Operation at Korea Standard Nuclear Power Plant, Dongeui University, 2005. [2] S. C. Jang, Development of Risk Assessment Technology for Low Power, Shutdown and Digital I&C Systems, KAERI/RR-2537/2004, 2005 [3] KAERI, MARS CODE MANUAL VOLUME Ⅱ : Input Requirements, KAERI/TR-2811/2004, 2010. [4] Y. H. Jin, Validation of Accident Analysis Capability of Fig. 11. SBO after LOOP Core Level MARS Code During Shutdown Operation, KAERI/TR- 2442/2003, 2003 [5] KAERI, “Development of the MARS Input Model for Ulchin 3/4 Transient Analyzer, KAERI/TR-2620/2003, 2003 Fig. 12. SBO after LOOP Cladding Temperature When SBO occurs, SCS fails to work due to power loss, core inventory is evaporated through the pressurizer, causing core level decreased and cladding temperature increased. After the success of offsite power recovery and the feed by HPSI actuated by an operator, as a result, the cladding temperature is recovered to a safe state. 4. Conclusions In this study, the accident scenarios for the LPSD POS5 of OPR-1000 were modelled and the success criteria were checked with focusing on the available time for operator actions using MARS-KS. As a result of representative sequences from each group, it was observed that safe recovery would be achieved without core melting at the suggested operation action timing. It should be noted that the reference model may be a little bit different depending on a specific OPR-1000, so detailed results may be also interpreted considering design specifications.

Download Presentation
Download Policy: The content available on the website is offered to you 'AS IS' for your personal information and use only. It cannot be commercialized, licensed, or distributed on other websites without prior consent from the author. To download a presentation, simply click this link. If you encounter any difficulties during the download process, it's possible that the publisher has removed the file from their server.

Recommend


More recommend