
SLIDE 1
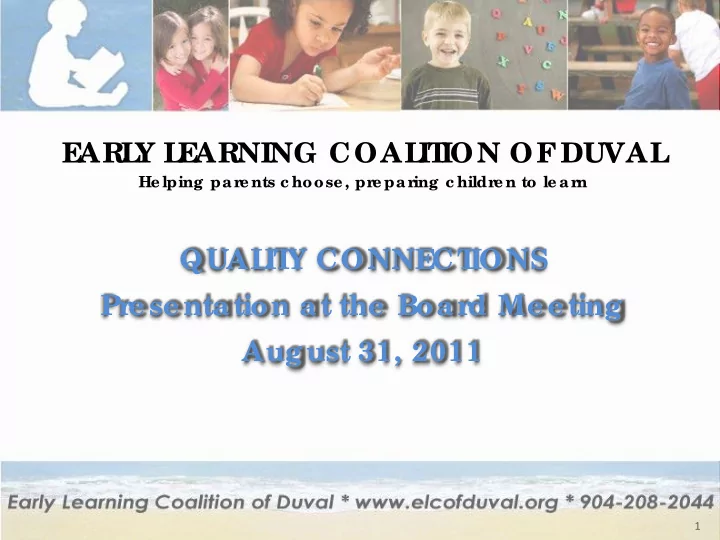
E ARL Y L E ARNING COAL IT ION OF DUVAL
He lping par e nts c hoose , pr e par ing c hildr e n to le ar n
QUAL IT Y CONNE CT IONS Pr e se ntation at the Boar d Me e ting August 31, 2011
1
E ARL Y L E ARNING COAL IT ION OF DUVAL He lping par e nts c - - PowerPoint PPT Presentation
E ARL Y L E ARNING COAL IT ION OF DUVAL He lping par e nts c hoose , pr e par ing c hildr e n to le ar n QUAL IT Y CONNE CT IONS Pr e se ntation at the Boar d Me e ting August 31, 2011 1 COALITION VISION STATEMENT All
He lping par e nts c hoose , pr e par ing c hildr e n to le ar n
1
2
3
4
5
1-2 INADEQUATE 3-4 - MINIMAL 5-6 - GOOD 7 - EXCELLENT
6
7
8
2.00 3.00 4.00 5.00 6.00 7.00 Space & Furnishings Personal Care Routines Listening & Talking Activities Interaction (Supervision) Program Structure OVERALL AVERAGE SCORE
3.58 1.97 4.87 4.97 4.15 4.82
10
2.00 3.00 4.00 5.00 6.00 7.00 Space & Furnishings Personal Care Routines Language & Reasoning Activities Interaction (Supervision) Program Structure OVERALL AVERAGE SCORE 3.30 2.81 5.28 5.35 3.83 4.58
11
HOW MUCH DID WE DO?
127 Infant / toddler classrooms 148 preschool classrooms
children (estimated)
HOW WELL DID WE DO IT?
classrooms
from intensive support to a hybrid of support and accountability / ownership
IS ANYONE BETTER OFF?
Quantity of Effect
benchmark of 3.0 or 3.50 average in ITERS + ECERS* combined OVERALL ITERS SCORE – 4.00 OVERALL ECERS SCORE – 4.18
*- ITERS – Infant Toddler Environment Rating Scale
Excellent
Quality of Effect
classrooms made the benchmark
12
Moving from intensive support to a hybrid of intensive & maintenance support 4.64 4.14 4.02 4.11
1.00 2.00 3.00 4.00 5.00 6.00 7.00
2007-08 2008-09 2009-10 2010-11
13