(Draft version) The effects of migration in the process of - - PDF document

draft version the effects of migration in the process of
SMART_READER_LITE
LIVE PREVIEW

(Draft version) The effects of migration in the process of - - PDF document

(Draft version) The effects of migration in the process of socio-spatial segregation: study of nine metropolitan areas in Brazil, 1990-2010. Jos Marcos Pinto da Cunha Alberto Augusto Eichman Jakob Introduction The effects of socio-spatial


slide-1
SLIDE 1

(Draft version) The effects of migration in the process of socio-spatial segregation: study

  • f nine metropolitan areas in Brazil, 1990-2010.

José Marcos Pinto da Cunha Alberto Augusto Eichman Jakob Introduction The effects of socio-spatial segregation on the living conditions of families and individuals have been widely discussed in the literature. The mechanisms that contribute to this effect are identified according to different approaches, each one emphasizing distinct aspects, varying from issues related to the existence of social capital to those that accentuate differences between places in terms of access to services and other opportunities that are available at regional level. But it is very difficult to find studies that deal with the effects of the migration on the socio- spatial segregation, and that is what we purpose with this paper. Considering the factors that put in movement individuals and families in the intra-urban space (especially those linked to land and labor market) is to be expected that the residential mobility within a large urban agglomeration presents not only a demographic selectivity, but also some selectivity in socio- economic terms. Thus, the focus of our analysis will be not only on the volume of migration, but also on the degree of selectivity of these migrants, always comparing with non-migrants of the local area. The initial planning of this study was consider the use of data related to the nine most important metropolitan areas of the country. However, it was concluded that in order to simplify the analysis and even avoid unnecessary repetitions, it would be sufficient to present the data of

  • nly three of them, which represent different geographical realities: São Paulo, Curitiba and

Recife (see Map 1). These Metropolitan Areas also represent different moments of formation and territorial expansion processes, degrees of complexity, diversity of their economic structure, and role in the network of cities in the country. São Paulo MA with a population of more than 17 million inhabitants is the most important urban-industrial area of the country. Curitiba MA is located in the southern region and presented a process of important economic and demographic growth from the 1990s. Finally, the Recife MA is one of the most important metropolitan agglomerations in the Brazilian Northeast, region with less economic development and serious social problems and the main area of emigration in the country in the years prior to 1990 (CUNHA, 2015).

slide-2
SLIDE 2

Map 1 Location of the selected Metropolitan Areas Fordist to post-Fordist metropolises: changes and contiguities This study is part of the debate of the impacts of productive restructuring and the process of globalization on the metropolitan areas, in particular those related to developing countries. In general, it is possible to say that in the latest decades the metropolis of the fordist period, characterized, among other dimensions, by demographic and industrial concentration, is gradually becoming into a new urban form that if not eliminates completely the characteristics

  • f the previous form, contributes to a complete metamorphosis in settlements’ places and,

therefore, in the traditional shape of a metropolitan area. In this new context that, especially in Brazil, arises in the late 1980s, it is possible to perceive the geographical dispersion of the production systems and the creation of new spatial arrangements, an intrinsic fact to capital to overcome its own crises of accumulation. These new urban morphologies (Lencione, 2003), although part of the new forms of urban structuration that usually surpass the metropolitan boundaries, also have implications inside the metropolitan

  • areas. So, the recovery of the leading role, growth and expansion of many metropolises were
slide-3
SLIDE 3
  • bserved, phenomenon named by Davidovich (2004) as the return of the metropolises, although

complemented by significant changes in the structure of the metropolis of the fordist period. In the Brazilian case, significant changes have been noted in the traditional Center-periphery dichotomy that, although is still easily identified in metropolitan contexts, have already greater complexity and diversity of situations. Not only by their own characteristics of social peripheries – not more homogeneous and places only of precariousness –, but also by the emergence of what we call "new peripheries" that start to hold population with the highest income. Thus, the analysis of two moments of migratory dynamics and urban-metropolitan expansion of Brazil and other different regional contexts can give evidences to identify changes in internal redistributive standards in these areas, as well as in the way that spatial mobility of the population contributed to the increase or reduction of socio-spatial segregation of these areas. Methodology The data for this analysis come from the Brazilian demographic censuses of 2000 and 2010, in which is possible to obtain information about population, socio-economic and demographic characteristics, in particular the migratory status, obtained from the question about residence five years prior to the census. In order to simplify the analysis, the municipalities of each metropolitan area are grouped into 5 categories: pole, subpole1, elitist periphery, Traditional short-distance periphery and Traditional long-distance periphery. Based on the assumption that the size and population density of the municipality would not be sufficient to qualify its position within the metropolis − since we can find cities of equal size, but with distinct functions − it was considered important to take into account also other variables whose objective were to evaluate the economic weight and socioeconomic composition of the municipalities. To this end, the following variables are used: total population; total added value, which corresponds to the sum of all economic values produced in the municipality at current prices; and the percentage of household heads with higher education in the municipality. Descriptive analysis will be carried out in order to assess the impact of migration on the characteristics of the resident population in the municipalities of destiny, as well as statistical analysis to differentiate the characteristics of migrants and non-migrants. In this sense, a regression model would be adjusted to measure the effects on the migrant status of the sociodemographic characteristics (age, sex, color, education and income) as well as the destination of these movements (types of municipalities) and the regional contexts where they

  • ccur (different metropolitan areas). It should be mentioned that the multilevel model would

not be used because there are only a few categories of type of municipalities and metropolitan

  • areas. These models will be adjusted for 2000 and 2010, seeking to observe if there have been

1 It is considered a "subpole" a large city with diversified economic and social functions but with more

restricted regional importance. In this city we can already observe the formation of its own peripheries.

slide-4
SLIDE 4

changes in behavior as a function of the moment (fordist or postfordist) of development of these metropolises. Results Although it is important to consider that external migration also has an impact on the dynamics

  • f production and expansion of metropolitan urban space, there is no doubt that the residential

mobility observed within these areas (intrametropolitan migration) is able to suggest in a very eloquent way the vectors of expansion of the population in this territory. Thus, maps 2, 3 and 4 confirm, for each of the chosen metropolitan areas, a striking feature of the process of metropolitan expansion in Brazil, that is, its centrifugal character, as the “regional pole” presenting itself as the main "provider" of population to the peripheries. Map 2 Intrametropolitan migratory flows – Metropolitan Area of São Paulo

slide-5
SLIDE 5

Map 3 Intrametropolitan migratory flows – Metropolitan Area of Curitiba Map 4 Intrametropolitan migratory flows – Metropolitan Area of Recife

slide-6
SLIDE 6

One of the expected goals of this paper it to discuss the role of the migration on the process of segregation observing the effects of migration on destination areas; in other words, we try to figure out if migrants are contributing to improve or not the demographic characteristics of these places. A still not exhaustive analysis of Table 1 that classifies the resident population by educational level and controlling it for its migratory condition and type of municipality of residence, allows us to observe some similar characteristics inside the MA but also important differences between them. As it is clear in the data presented in Table 1, in the last two MAs, that the weight and importance

  • f interstate migration has had different impacts on the socio-spatial segregation process when

compared to what occurs in the SPMA, in which intrametropolitan migration plays a distinct role. In general terms, from the point of view of the impact of migration on the socio-spatial segregation process, the data reveal some interesting characteristics: a) Firstly, it should be noted that the educational level of the MAs showed a great evolution from 1991 to 2010, reflecting the progress observed in the country as a whole; this trend implies that the profile of migrants and the total population changed significantly over the three periods considered; b) However, the distinguished profile of the migrants who are moving to the “pole” and “subpole” municipalities or even towards the “Elitist Periphery” in comparison to those of the Traditional Periphery is remarkable; such a finding leaves no doubt that migration reinforces segregation in the three MAs; c) Regarding the migration modality, it can be seen that, in the case of the São Paulo MA, the migration to the “pole” is much more schooled, a fact that reflects the position of the city of São Paulo as an area of attraction of people with the highest qualification. However, it is interesting to note that intrametropolitan and intrastate migrants are more schooled than those who come from other states. This characteristic suggests the differential profile of migrants according to distance. d) The figure is not observed in the case of the two other MAs, in which the interstate migration reinforces the positive selectivity in the “pole”, increasing the socioeconomic differentiation of the “pole” in relation to the other municipalities, in particular, the Traditional Periphery. For example, in the case of Recife MA, almost half of the interstate migrants who go to the “pole” have completed higher education against 32% of intrametropolitan migrants; in the case of Curitiba something similar can be observed. This behavior reveals that the recovery that these two areas (and most of the states to which they belong) presented in migratory terms from the 1990s reflects the attraction of more qualified people established at the regional poles; e) The data also show the intensification of the movements of people of high schooling to the periphery (specifically to “Elitist Periphery”) from the observation that the profile of the

slide-7
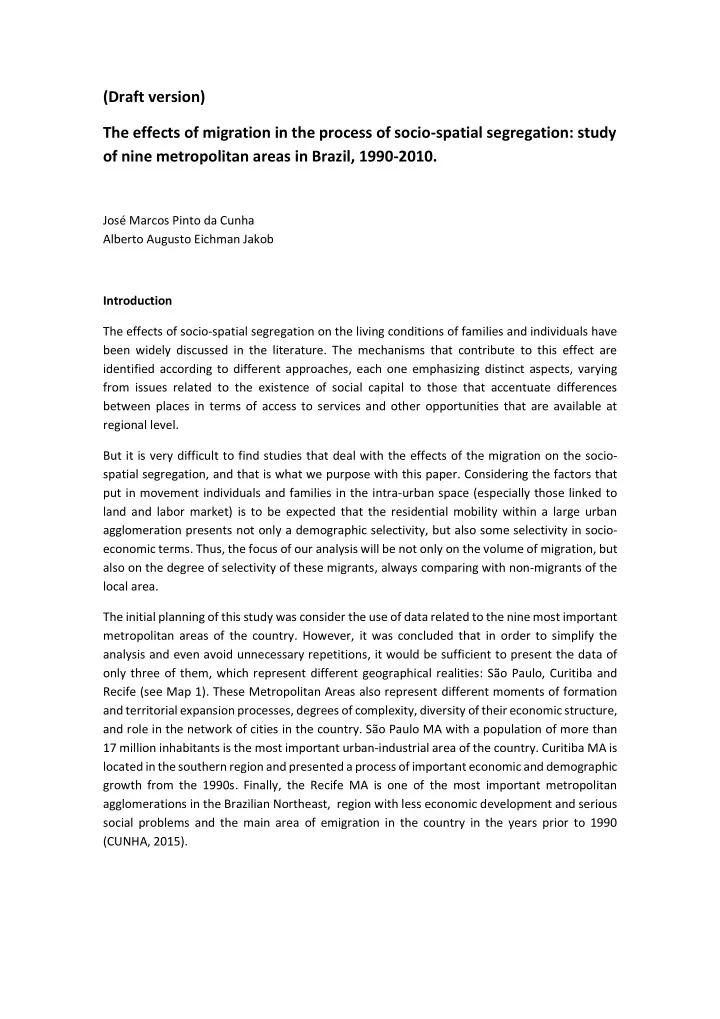
SLIDE 7

intrametropolitan and intrastate migrants presents a higher concentration of people with higher education; Table 1 Resident population by category of municipalities, migratory modality and level of education. Selected Metropolitan Areas (São Paulo, Curitiba and Recife) – 1991, 2000 and 2010 With this paper, we expect also to find which demographic variables have more influence on the socio-spatial segregation of population. According to our hypothesis, it is expected that age, education, income and color have expressive effects over the migratory status, and this status

1991 2000 2010 1991 2000 2010 1991 2000 2010 2000 2010 2010 Intrametropolitan 34,3% 28,9% 14,4% 39,2% 35,8% 10,8% 13,4% 19,1% 32,7% 13,2% 16,2% 42,0% Intrastate 28,3% 26,2% 11,1% 31,9% 30,0% 7,5% 16,5% 20,5% 31,8% 23,3% 23,3% 49,6% Interstate 46,5% 40,2% 37,0% 40,2% 40,5% 16,3% 7,9% 12,3% 24,6% 5,4% 7,0% 22,2% Total Population 64,5% 48,3% 38,1% 14,3% 19,5% 18,6% 13,8% 22,6% 27,0% 7,4% 9,6% 16,3% Intrametropolitan 37,7% 32,6% 23,7% 40,3% 38,9% 14,1% 14,3% 19,8% 32,0% 7,8% 8,7% 30,1% Intrastate 38,6% 33,1% 23,4% 39,5% 38,0% 14,8% 14,1% 20,1% 33,7% 7,8% 8,8% 28,0% Interstate 49,2% 43,7% 43,3% 42,1% 43,1% 19,8% 7,0% 11,2% 27,4% 1,7% 2,1% 9,4% Total Population 69,2% 51,5% 38,4% 14,3% 20,1% 19,3% 12,1% 22,1% 29,4% 4,4% 6,2% 12,9% Intrametropolitan 41,3% 34,5% 28,1% 40,6% 39,8% 13,3% 8,3% 14,7% 28,6% 9,7% 11,0% 30,0% Intrastate 40,5% 36,3% 23,9% 41,4% 38,1% 16,2% 5,9% 13,0% 32,7% 12,2% 12,5% 27,2% Interstate 48,4% 43,7% 44,4% 41,4% 42,1% 15,5% 5,9% 9,4% 25,4% 4,2% 4,8% 14,6% Total Population 74,0% 55,9% 40,7% 11,9% 18,6% 18,7% 9,4% 18,7% 27,7% 4,6% 6,8% 12,9% Intrametropolitan 44,7% 38,3% 32,5% 45,4% 43,5% 19,7% 7,5% 14,3% 35,0% 2,3% 3,9% 12,9% Intrastate 46,3% 41,1% 35,4% 43,7% 44,0% 18,9% 6,7% 11,2% 32,8% 3,3% 3,6% 12,8% Interstate 51,7% 45,5% 48,2% 42,2% 44,5% 22,1% 5,0% 8,7% 25,7% 1,1% 1,3% 4,0% Total Population 79,6% 60,6% 44,5% 12,3% 20,4% 20,4% 6,6% 16,6% 29,0% 1,6% 2,5% 6,1% Intrametropolitan 48,8% 41,3% 39,9% 44,3% 44,1% 19,6% 5,5% 11,9% 31,0% 1,4% 2,7% 9,5% Intrastate 46,8% 44,0% 44,8% 42,1% 43,7% 15,8% 7,2% 7,4% 25,8% 4,0% 4,9% 13,6% Interstate 53,4% 49,3% 55,7% 42,8% 43,0% 20,4% 2,7% 7,2% 21,8% 1,1% 0,5% 2,2% Total Population 84,5% 66,7% 49,5% 9,4% 18,2% 20,2% 5,0% 13,4% 25,6% 1,2% 1,8% 4,7% Intrametropolitan 43,7% 35,0% 21,2% 41,5% 40,8% 18,8% 11,0% 19,7% 39,2% 3,8% 4,6% 20,8% Intrastate 38,5% 31,0% 22,3% 39,5% 36,8% 16,0% 15,2% 21,8% 34,9% 6,8% 10,5% 26,8% Interstate 27,2% 21,5% 14,2% 32,4% 27,6% 10,9% 22,9% 27,3% 37,2% 17,5% 23,7% 37,7% Total Population 59,4% 41,9% 31,9% 15,0% 20,1% 17,8% 17,6% 26,6% 30,1% 8,1% 11,4% 20,2% Intrametropolitan 42,6% 35,5% 33,6% 44,7% 42,4% 17,6% 10,5% 18,5% 35,1% 2,2% 3,6% 13,7% Intrastate 51,2% 42,7% 41,1% 44,6% 44,9% 22,4% 3,1% 10,8% 27,4% 1,1% 1,7% 9,0% Interstate 43,6% 37,1% 34,5% 43,7% 42,4% 21,4% 10,3% 17,9% 32,6% 2,4% 2,6% 11,5% Total Population 81,7% 63,7% 48,8% 10,1% 19,9% 20,8% 6,9% 14,4% 24,4% 1,3% 2,0% 6,1% Intrametropolitan 45,3% 33,0% 29,0% 43,1% 39,6% 18,1% 8,1% 23,0% 35,2% 3,5% 4,4% 17,7% Intrastate 50,3% 39,6% 34,3% 46,6% 43,7% 19,0% 3,1% 14,9% 38,8% 0,0% 1,8% 7,9% Interstate 45,9% 32,6% 33,5% 44,4% 42,8% 14,6% 3,5% 19,7% 34,6% 6,2% 4,8% 17,2% Total Population 84,0% 57,8% 45,7% 7,5% 22,2% 20,9% 6,9% 17,7% 26,1% 1,6% 2,3% 7,3% Intrametropolitan 45,8% 40,8% 47,9% 46,2% 46,2% 19,3% 5,9% 11,4% 26,6% 2,1% 1,7% 6,2% Intrastate 49,9% 44,9% 54,5% 44,7% 44,9% 20,3% 4,3% 9,4% 21,1% 1,1% 0,8% 4,1% Interstate 46,5% 42,6% 45,4% 43,9% 47,0% 17,0% 7,0% 10,0% 30,3% 2,6% 0,4% 7,4% Total Population 83,5% 71,1% 57,9% 10,1% 18,1% 19,5% 5,4% 9,8% 19,2% 1,0% 1,0% 3,4% Intrametropolitan 44,9% 44,4% 62,5% 40,3% 44,6% 16,7% 12,7% 9,0% 17,4% 2,1% 2,0% 3,4% Intrastate 45,1% 44,4% 56,7% 36,8% 46,1% 10,7% 14,3% 6,7% 22,1% 3,9% 2,8% 10,5% Interstate 41,6% 41,2% 51,0% 42,1% 38,8% 12,1% 11,0% 13,2% 21,9% 5,3% 6,7% 15,0% Total Population 90,7% 76,5% 66,3% 4,7% 13,8% 15,3% 4,1% 8,6% 14,7% 0,5% 1,0% 3,6% Intrametropolitan 32,3% 29,1% 16,6% 33,3% 31,7% 11,9% 23,2% 23,1% 39,1% 11,2% 16,2% 32,4% Intrastate 46,7% 35,5% 29,3% 32,2% 34,1% 16,1% 13,0% 18,5% 34,1% 8,1% 12,0% 20,5% Interstate 27,5% 21,3% 11,6% 26,8% 24,9% 5,7% 23,0% 25,8% 33,9% 22,7% 28,0% 48,8% Total Population 66,2% 37,5% 39,8% 12,3% 33,4% 16,6% 14,6% 22,0% 29,2% 7,0% 7,0% 14,4% Intrametropolitan 33,1% 32,4% 28,3% 36,0% 34,2% 16,6% 23,3% 24,5% 40,7% 7,6% 8,9% 14,5% Intrastate 52,7% 43,9% 50,3% 35,9% 40,0% 12,8% 8,2% 12,8% 28,8% 3,1% 3,3% 8,2% Interstate 35,1% 28,5% 14,8% 33,6% 32,8% 9,9% 20,8% 27,1% 45,7% 10,6% 11,5% 29,7% Total Population 72,5% 59,0% 46,0% 11,9% 16,6% 17,6% 12,1% 19,6% 29,4% 3,5% 4,8% 7,0% Intrametropolitan 38,6% 34,0% 36,9% 37,8% 36,1% 15,6% 19,0% 23,9% 38,8% 4,6% 6,0% 8,6% Intrastate 56,4% 48,0% 61,3% 35,8% 39,3% 12,0% 6,5% 11,0% 22,5% 1,3% 1,7% 4,2% Interstate 41,9% 36,6% 35,9% 37,4% 38,2% 15,8% 16,4% 21,7% 42,2% 4,2% 3,5% 6,1% Total Population 78,0% 64,3% 49,3% 10,7% 16,8% 17,6% 9,6% 16,8% 29,2% 1,6% 2,2% 3,9% Intrametropolitan 49,7% 39,4% 44,9% 38,1% 38,5% 17,3% 9,1% 18,4% 30,0% 3,1% 3,6% 7,8% Intrastate 59,5% 51,4% 58,0% 36,0% 38,5% 18,5% 4,2% 7,6% 20,6% 0,4% 2,5% 2,9% Interstate 54,1% 39,0% 37,4% 37,0% 41,7% 14,9% 7,8% 14,6% 43,0% 1,0% 4,7% 4,7% Total Population 88,2% 77,3% 60,9% 6,0% 11,7% 15,7% 5,2% 9,9% 21,1% 0,7% 1,2% 2,3%

Source: IBGE, Demographic Censuses, 1991, 2000 and 2010 (Tabulations, NEPO-Unicamp)

Recife Metropolitan Area Pole Subpole Tradcional short- distance Periphery Tradcional long- distance Periphery Curitiba Metropolitan Area Pole Subpole Elitist Periphery Tradcional short- distance Periphery Tradcional long- distance Periphery São Paulo Metropolitan Area Pole Subpole Elitist Periphery Tradcional short- distance Periphery Tradcional long- distance Periphery RM Category of municipality/migratory modality no instruction or incomplete elementary school complete elmentary school or incomplete high school Complete high school or incomplete higher education Complete higher education

slide-8
SLIDE 8

varies according to the territorial context where they are analyzed, i.e., we expect that such effects would be different according the types of municipalities and regional contexts where they are observed. Unfortunately, it was not yet possible to adjust the statistical model to support our hypotheses, but this task should be done soon. Bibliography COURGEAU, D. and LELIEVRE, E. Individual and social motivations for migration. In: Caseli, g. Vallin, J. and Wunsh, G. Demography: analysis and synthesis: a treatise in population studies. Oxford: Elsevier, 2006. CUNHA, J. M. P. A migração interna no Brasil nos últimos cinquenta anos: (des)continuidades e

  • rupturas. In: ARRETCHE, M. Trajetórias das desigualdades: como o Brasil mudou nos últimos

cinquenta anos. São Paulo: Editora UNESP; CEM, 2015, 279-307. CUNHA, J. M. P .Population Dynamics and Migration: 1991-2010. In: MARQUES, E. S. L. (Org.). São Paulo in the Twenty-First Century: Spaces, Heterogeneities, Inequalities. 1 ed.Noba Iorque: Routledge, 2016, v. 1, p. 101-119. CUNHA, J. M. P. et all A mobilidade pendular na Macrometrópole Paulista: diferenciação e complementariedade socioespacial.. Cadernos Metrópole (PUCSP), v. 15, p. 433-459, 2013. CUNHA, J. M. P. Movilidad espacial, vulnerabilidad y segregación socioespacial: Reflexiones a partir del estudio de la Región Metropolitana de Campinas, 2007. Notas de Población, Santiago- Chile, Año XXXVIII, N° 93, 169-209. DAVIDOVICH, F. “A ‘volta da metrópole’ no Brasil: referências para a gestão territorial. In: RIBEIRO, L. C. de Q. (org.) (2004). Metrópoles entre a coesão e a fragmentação, a cooperação e

  • conflito. São Paulo/Rio de Janeiro, Editora Fundação Perseu Abramo/ FASE – Federação de

Órgãos para Assistência Social e Educacional. GARREAU, J Edge city: life in the new frontier. Nueva York: Doubleday, 1991. INDOVINA, F. La città diffusa, Venècia: DAEST-IUAV, 1991. LENCIONI, S. A emergência de um novo fato urbano de caráter metropolitano em São Paulo. A particularidade de seu conteúdo sócio-espacial, seus limites regionais e sua interpretação teórica. In: ENCONTRO NACIONAL DA ANPUR, 2003. LENCIONI, S. A metamorfose de São Paulo: o anúncio de um novo mundo de aglomerações

  • difusas. Revista Paranaense de Desenvolvimento, v. 120, p. 133-148-148, 2011

SASSEN, S. The Global City: New York, London, Tokyo. New Jersey: Pricenton University Press, 2001. SCOTT, A. et al. Cidades-regiões globais. Espaço e debates: aliança e competição entre cidades, São Paulo, n. 41, p. 11-25, 2001.