
SLIDE 1
1
1 2 3 State R&D Graphic, Version 1 Version 1 4 State - - PowerPoint PPT Presentation
1 2 3 State R&D Graphic, Version 1 Version 1 4 State R&D Graphic, Version 1, Version 1, markup 5 Framework for Monetary Flow for R&D State R&D Graphic, Version 3 Version 3 Other Funding Sources (local governments,
1
2
3
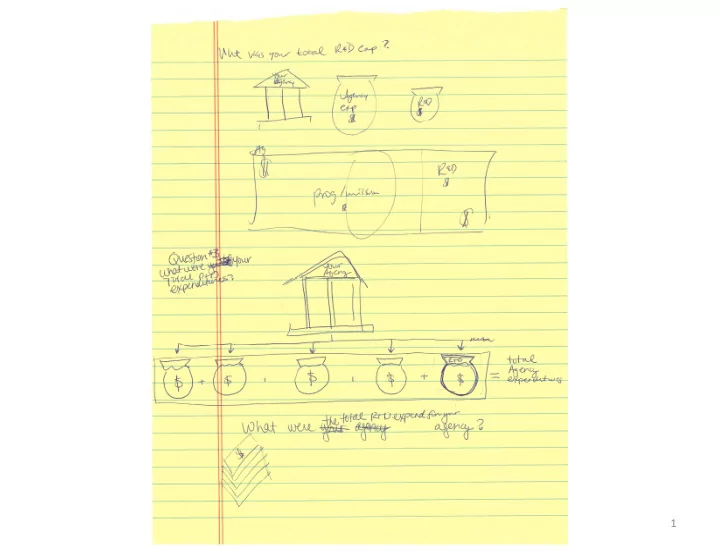
State R&D Graphic, Version 1 Version 1
4
State R&D Graphic, Version 1, Version 1, markup
5
Framework for Monetary Flow for R&D
State R&D Graphic, Version 3
Federal Government State Government Other Funding Sources (local governments, other state governments, businesses, non-profits, etc.
Version 3 (Tested with respondents,
Your Agency’ s Total R&D
p , Spring 2015)
Internal External Higher Educational Other Entities Companies and Your Agency Higher Educational Institutions Other Entities Performing R&D Companies and Individuals
6
7
R&D Funding Structures
State R&D Graphic, Version 3c
Federal Government State Government Other Funding Sources (local governments, other state governments, businesses, non-profits, etc.)
Version 3c
Your Agency’ s Total R&D Internal External Higher Educational Other Entities Companies and Your Agency Higher Educational Institutions Other Entities Performing R&D Companies and Individuals
8
R&D Funding Structures
State R&D Graphic, Version 3d
Federal Government State Government Other Funding Sources (local governments, other state governments, businesses, non-profits, etc.)
Version 3d
Your Agency’s Total R&D Internal External g y Your Agency Higher Educational Institutions Other Entities Performing R&D Companies and Individuals
9
R&D Funding Structures
State R&D Graphic, Version 4
Federal Government State Government Other Funding Sources (local governments, other state governments, businesses, non-profits, etc.)
Version 4
Your Agency’ s Total R&D Internal External Your Agency Higher Educational Institutions Other Entities Performing R&D Companies and Individuals
10
11
Federal Other sources Individual donors Internal funds Other nonprofits Businesses State and local Federal government Internal funds, including endowments Other nonprofits, including universi es Businesses State and local government Your
funds for research
Research Performance Research Funding
Your organiza on Universi es or
en es Other nonprofit
Businesses Other
12
13
14
15