Draft Solid W aste Managem ent Plan GVS&DD Board Workshop - - PDF document

draft solid w aste managem ent plan
SMART_READER_LITE
LIVE PREVIEW

Draft Solid W aste Managem ent Plan GVS&DD Board Workshop - - PDF document

Developing Metro Vancouvers Draft Solid W aste Managem ent Plan GVS&DD Board Workshop December 4, 2009 Workshop Overview SWMP Overview Zero Waste Challenge Actions Diversion Target & Timeline Managing Waste After


slide-1
SLIDE 1

1

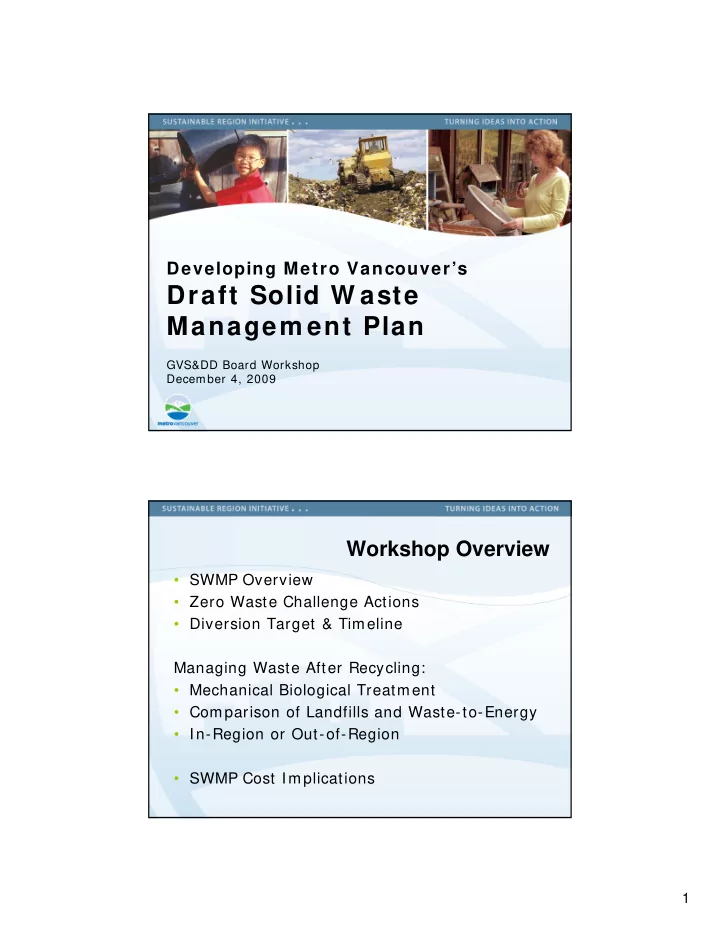
Developing Metro Vancouver’s

Draft Solid W aste Managem ent Plan

GVS&DD Board Workshop December 4, 2009

Workshop Overview

  • SWMP Overview
  • Zero Waste Challenge Actions
  • Diversion Target & Timeline

Managing Waste After Recycling:

  • Mechanical Biological Treatment
  • Comparison of Landfills and Waste-to-Energy
  • In-Region or Out-of-Region
  • SWMP Cost Implications
slide-2
SLIDE 2

2

SWMP Context

  • SWMP authorized and regulated through the

BC Environmental Management Act

  • Approved SWMP becomes a regulatory

document for solid waste management for the Region

  • Draft SWMP proposed to replace existing

1995 SWMP

CCLF Replacement Process

  • CCLF replacement under 1995 Plan
  • ALF EAO suspended, June 2005
  • Provincially directed review of alternatives

Elaborate process involving RFEOI, independent review, advisory panel and many public/ First Nations meetings

  • Board adopts Zero Waste Challenge, 2006
  • Jan 2008 strategy paper and Board directive

Abandon landfills in the interior of BC Focus efforts on ZWC, composting, local WTE Outreach on proposed strategy

slide-3
SLIDE 3

3

SWMP Development Process

  • Develop ZWC, actions, target

Options analysis Outreach Recommended approach

  • Board endorsement of 70% diversion target
  • Develop residual waste management strategy

Options analysis Outreach Recommended approach Integration of ZWC and RWM into consolidated draft plan

  • Board consideration of draft plan prior to formal public

consultation (today)

Waste Reduction, Reuse and Recycling

slide-4
SLIDE 4

4

Development of Waste Reduction, Reuse and Recycling Options

  • Collaboratively developed through:

Board and Waste Management Committee workshops Stakeholders, community Municipal staff including: REAC, REAC Solid Waste Subcommittee, Recycling Coordinators

  • Initial focus on actions and strategies
  • Analysis and compilation of actions
  • Development of numeric targets

Actions While Planning

  • Parallel to planning process implemented

waste diversion actions based on 2008 strategy paper and community input on Zero Waste Challenge

slide-5
SLIDE 5

5

  • Annual Christmas Campaigns
  • Additional Material Disposal Bans aligned with

Provincial Extended Producer Responsibility programs

  • Outreach programs to reinforce disposal bans
  • Increased inspections and tighter restrictions

to enforce the bans

  • Reduced tipping fee to encourage green

waste composting

Actions While Planning

Metro Vancouver Recycles

slide-6
SLIDE 6

6

Electronics Disposal Bans Swangard Stadium

slide-7
SLIDE 7

7

Surrey Vaisakhi Parade Home Depot Wood Waste Diversion Pilot

slide-8
SLIDE 8

8

Multi-Residential Solid Waste Diversion Pilot Regional Food Waste Composting

Fraser Richmond Soil & Fibre

slide-9
SLIDE 9

9

Current Initiatives

Biofuel facility Eco-Centres Analysis and Compilation of Actions

  • Input from community and stakeholders at

workshops

  • Assessment of feasibility and desirability with

municipal staff (engineering and recycling coordinators)

Reviews include technical, financial, environmental and social

  • Based on this assessment develop draft

action plan

Development of Waste Reduction, Reuse and Recycling Options

slide-10
SLIDE 10

10

Actions are organized under 2 goals Goal 1 - Reduce Goal 2 - Reuse, Recycle, Recover materials

Draft Action Plan

1 . Be a strong advocate for Extended Producer Responsibility ( EPR)

  • 2. Participate in Federal EPR initiatives to develop national

guidelines for sustainable packaging

  • 3. Participate on industry stewardship advisory committees
  • 4. Participate on BC Product Stewardship Council to assist in

evaluating existing and developing new EPR programs 5 . Create form al partnership w ith Ministry of Environm ent, including Metro staff representation, to accelerate EPR program developm ent and im plem entation

Goal 1- Minimize Generation

Strategy 1.1 Advocate for responsibility shift to producers and consumers

slide-11
SLIDE 11

11

1 . W ork w ith disposal facility operators, local m unicipalities and the recycling industry to introduce m aterial bans after suitable public inform ation program s

Goal 1- Minimize Generation

Strategy 1.2 Reduce or Eliminate materials which hinder or limit reuse, recycling, or energy recovery, or that may increase environmental impacts of disposed residuals

1 . Develop and deliver a com m unity based social m arketing program to inform and educate citizens

  • n w aste reduction opportunities

2. Develop and deliver a community based social marketing business education plan, including business guides and

  • ther outreach programs to inform and educate

businesses on waste reduction opportunities

Goal 1- Minimize Generation

Strategy 1.3 Provide information and education on options to reduce waste

slide-12
SLIDE 12

12 1 . I nvestigate financial and regulatory barriers w hich prevent or discourage the reuse of m aterials

  • 2. Investigate the effectiveness and adequacy of

existing material exchange networks

  • 3. Bring forward appropriate measures which

respond to the findings

Goal 2 – Maximize Reuse, Recycling and Material Recovery

Strategy 2.1 Increase the opportunities for reuse

1. Implement disposal bans on materials that limit opportunities to achieve reuse, recycling, or energy recovery

a) Work with disposal facility operators, local municipalities and the recycling industry to determine the impact and source of components

  • f the waste stream, the consequence and feasibility of banning

materials with the most negative impacts and the most suitable recycling options for those materials b) Continue the m onitoring and enforcem ent of the disposal bans c) I ntroduce m aterial bans after suitable public inform ation program s d) Analyze the effectiveness of disposal bans and possible alternate enforcement models including enforcement at source e) After suitable public information programs, expand disposal bans to include materials encompassed by new EPR programs and material for which new recycling markets are developed

Goal 2 – Maximize Reuse, Recycling and Material Recovery

Strategy 2.2 Increase the effectiveness of existing recycling programs

slide-13
SLIDE 13

13

  • 1. Inform businesses and residents of recycling
  • pportunities

a) Continue and upgrade a regional w eb-based source of inform ation on recycling opportunities for businesses and residents b) Keep municipalities fully informed as to recycling collection and drop off facilities and changes to policies and facilities c) Provide outreach services

Goal 2 – Maximize Reuse, Recycling and Material Recovery

Strategy 2.2 Increase the effectiveness of existing recycling programs 3 . I ncrease the efficiency and consistency of recycling collection services across the region

a) Work with municipalities to review materials accepted from residential and ICI sources b) In collaboration with municipalities, undertake a business case review of the residential and ICI waste and recycling collection services over the region to determine and implement the appropriate level of consistency between municipalities

Goal 2 – Maximize Reuse, Recycling and Material Recovery

Strategy 2.2 Increase the effectiveness of existing recycling programs

slide-14
SLIDE 14

14

4 . Establish Eco-Centres

a) Establish a work group to determine the terms and conditions for participating municipalities and industries and the means

  • f integrating Eco-Centres into Metro Vancouver’s transfer

station system and municipal depot systems b) Develop the model of Eco-Centres, new one-stop-drop centres for recycling. c) With municipalities, determine the terms and conditions for participating municipalities and industries and develop appropriate business cases. d) Establish the first Eco-Centre in Surrey e) Progressively expand the Eco-Centre system across the region as municipal business cases determine

Goal 2 – Maximize Reuse, Recycling and Material Recovery

Strategy 2.2 Increase the effectiveness of existing recycling programs

5. Promote recycling at festivals and events

a) Com plete pilot studies on Zero W aste initiatives at festivals and events b) Develop a Zero Waste toolkit for festivals and events c) Continue to work with municipalities, EPR groups and local community groups to implement waste minimization and recycling at community festivals and events, including conferences and tradeshows d) Provide outreach services

6. Work with School Districts and private schools to conduct pilot programs to promote waste reduction and recycling

Goal 2 – Maximize Reuse, Recycling and Material Recovery

Strategy 2.2 Increase the effectiveness of existing recycling programs

slide-15
SLIDE 15

15

1. Facilitate the siting of private sector recycling activities

a) Review the GVS&DD Solid Waste Regulatory Bylaw to facilitate the siting of municipal solid waste facilities that meet municipal bylaw

2. Foster market development for recycled materials

a) Evaluate a business case for a regional scale recycling service delivery model b) Review desirability, feasibility and opportunity for establishing a non-profit

  • rganization to facilitate the development of recycling businesses and markets,

along the lines of the ‘London Remade’ model in the U.K c) Subject to above, establish a regional role in processing and marketing of recycled materials, a land acquisition strategy for required recycling facilities, and enhanced policy-based initiatives to promote local recycled content in consumer goods

3. Municipalities will review zoning bylaws to remove unnecessary impediments to and encourage recycling and material recovery activities in appropriately zoned areas. 4. Provincial and Federal Governments to identify and establish minimum post-consumer recycled content requirements for consumer goods

Goal 2 – Maximize Reuse, Recycling and Material Recovery

Strategy 2.3 Facilitate increased private sector recycling

1. Encourage the reuse of wood

a) Examine and, where feasible, implement incentives for re-use and remove barriers to re-use of wood waste b) Develop and implement information and education programs on the reuse and effective recycling of DLC waste

2. Implement waste reduction strategies directed toward diverting DLC waste from disposal while supporting opportunities for beneficial use

a) Encourage the role of building supply retailers and producers in the collection of DLC m aterial for recycling b) Provide areas for separated recyclable DLC materials at Eco-Centres and at transfer stations as they are upgraded

3. In collaboration with municipalities and industry groups, develop a policy and amendment to this plan to regionally mandate DLC recycling at the job site by December 2011. A schedule for implementation will be part of the policy

Goal 2 – Maximize Reuse, Recycling and Material Recovery

Strategy 2.4 Target demolition, land clearing and construction (DLC) sector for increased reuse and recycling

slide-16
SLIDE 16

16

4. Review existing DLC recycling and processing capacity, project future needs and develop a strategy to address any identified gaps 5 . Municipalities w ill w ork w ith Metro Vancouver to develop a policy and am endm ent to this plan to regionally m andate DLC recycling at the job site by Decem ber 2 0 1 1

a) review municipal DLC permitting processes with a view to requiring waste management plans as a condition of such permits b) review the desirability and feasibility of deposit systems or other financial incentives to increase enforcement of DLC waste management plans.

6. Provincial Government to expand the inclusion of the re-use of wood in building codes

Goal 2 – Maximize Reuse, Recycling and Material Recovery

Strategy 2.4 Target demolition, land clearing and construction (DLC) sector for increased reuse and recycling

1. In collaboration with municipalities, conduct pilot programs to determine the most effective method of reducing unwanted junk mail and other publications and act accordingly on the results 2. Promote reduced paper use and increase paper recycling

  • pportunities in the community and businesses

a) Carry out a com m unity based social m arketing cam paign to determ ine and overcom e barriers to reducing the use of and increasing the recycling of paper in schools and com m unity facilities b) Carry out a targeted outreach campaign to business to determine and overcome barriers to reducing the use of and increasing the recycling of paper

Goal 2 – Maximize Reuse, Recycling and Material Recovery

Strategy 2.5 Reduce paper and paperboard being disposed

slide-17
SLIDE 17

17

1. Evaluate options for processing of organics with biosolids and

  • ther utility residuals

a) Complete trials on commingling food waste with wastewater solids to produce bio-fuels b) Determine costs and benefits of commingling bio-solids with other residuals c) Bring forward appropriate actions based on results

2. Divert organics from the waste stream

a) Establish one or m ore organics processing facilities b) Determine which paper and paperboard products are suitable for processing at an organics management facility c) In collaboration with municipalities, develop and implement a work plan for the diversion of organic waste, including food waste, from: single family residences, multi-family residences and the I CI sector d) Develop and implement supporting communication programs

Goal 2 – Maximize Reuse, Recycling and Material Recovery

Strategy 2.6 Target Organics for Recovery

3 . Municipalities w ill divert organics from the w aste stream to a Metro Vancouver or alternative licensed

  • rganics processing facility

4. Municipalities will report the tonnage of diverted organic waste to Metro Vancouver in the event that organics are delivered to licensed non-regional processing facilities

Goal 2 – Maximize Reuse, Recycling and Material Recovery

Strategy 2.6 Target Organics for Recovery

slide-18
SLIDE 18

18

1. Expand the recycling of plastics in the residential and commercial sectors a) Establish a standard for municipal programs for collection of plastics based on market strength b) In cooperation with retail partners and municipalities, undertake social marketing pilot programs to reduce the use

  • f disposable take-out food and beverage packaging including

plastic and other disposable bags 2 . The Provincial Governm ent to develop EPR program s for all plastics that provide incentives for alternatives to non- recyclable plastics 3. The Provincial and Federal Governments to require all plastic material sold in BC to have a material code identifying its composition

Goal 2 – Maximize Reuse, Recycling and Material Recovery

Strategy 2.7 Target plastics for increased recycling

1 . Develop bylaw s to require recycling in all m ulti-fam ily and com m ercial buildings and com plexes. a) Develop a model bylaw and enforcement model to require recycling in multi-family and commercial buildings b) Create an advisory service for recycling program s for m ultifam ily and com m ercial buildings 2. Municipalities will work with Metro Vancouver to implement recycling in multi-family and commercial buildings

Goal 2 – Maximize Reuse, Recycling and Material Recovery

Strategy 2.8 Target multi-family and industrial, commercial and institutional (ICI) sectors to improve diversion rates

slide-19
SLIDE 19

19

Development of Targets

  • Analysis of actions within and outside our

jurisdiction and their relative likely effectiveness

  • Conducted for each component of the waste

stream

  • Quantification of impact of actions for each

component of the waste stream

  • Combining these analyses results in an
  • verall diversion target of 70%

Goals 1 & 2 - Targets

600,000 Total 10,000

EPR - Small Appliances

10,000

EPR - E-Waste

E-Waste and Small Appliances 60,000

Disposal Bans

Yard Waste 30,000

Expansion of Plastics Recycling

Plastic Waste 170,000

Composting

Food Waste 50,000

Composting

115,000

Enhanced Disposal Bans

Paper and Paperboard 70,000

Provide Wood Drop Off Facilities at Transfer Stations/Eco-Centres

85,000

Modifications to Demolition and Building Permit Process

Wood Waste Estimated Additional Capture (tonnes) Diversion Program

slide-20
SLIDE 20

20

Outreach on Actions and Targets

  • Tested these actions and targets with

Municipal staff Community stakeholders

  • Municipal staff tended to see financial implications and
  • perational challenges – 70% accepted but considered

an aggressive target

  • Community and stakeholders tended to see the long

term goal of zero waste - 70% accepted, but considered an interim target

  • Focus groups validated 70% but tended to be more

conservative than community and stakeholders

Remaining Waste

  • Products constructed of multiple materials
  • Contaminated materials
  • Textiles, leather, personal hygiene products
  • Residual material from recycling (plastics 20% )
slide-21
SLIDE 21

21

Best Practices

  • BC Beverage container recycling rate: 77%
  • Best paper recycling rate: 66%
  • Best plastic packaging recycling rate: 30%
  • Best diversion rates in world: about 70%

Participation

Overall Participation Individual Diligence Diversion Rate

x = 80% x 80% = 64%

slide-22
SLIDE 22

22

Growth

Future W aste Quantities: 2 million people @ 55% = 1.5 M tonnes 3 million people @ 70% = 1.5 M tonnes

A Zero Waste Economy A Zero Waste Economy

Resource Extraction Production Distribution Consumption Waste Disposal Design for Environment Clean Production Distribution Producer Responsibility Informed Consumers Resource Recovery

Linear Economy Zero Waste Economy

slide-23
SLIDE 23

23

Q&A Q&A Discussion Discussion

Managing the Remaining Waste

slide-24
SLIDE 24

24

Mechanical Biological Treatment Mechanical Biological Treatment

Edmonton

slide-25
SLIDE 25

25

Refuse Derived Fuel

Port Mellon Gold River

MBT-to-Landfill

slide-26
SLIDE 26

26

Net Energy Production

Net Energy Production

80,000 30,000 14,000 10,000 20,000 30,000 40,000 50,000 60,000 70,000 80,000 90,000 Large New WTE Out-of-Region Use of RDF Product from MBT Maximize Out-of-Region Landfilling Local Landfilling of MBT Product

Homes

Total System Costs Over 35 Years

$0 $1,000,000,000 $2,000,000,000 $3,000,000,000 $4,000,000,000 $5,000,000,000 $6,000,000,000 $7,000,000,000 $8,000,000,000 Large New WTE Out-of-Region use of RDF product of MBT Out-of-Region Dry- Tomb Landfill Local Landfilling of MBT Product

MBT Adds Cost

slide-27
SLIDE 27

27

Net GHG Emissions

Cost of GHG Reduction: MBT is not a cost effective solution to achieve Greenhouse Gas reductions because the cost per tonne of reduction far exceeds the cost of

  • ther GHG reduction

strategies. MBT comes at a $5 billion cost premium ($500/ tonne GHG reduction)

Net GHG Emissions

344,600 449,400 403,000 57,500 50,000 100,000 150,000 200,000 250,000 300,000 350,000 400,000 450,000 500,000 Large New WTE Out-of-Region Use of RDF Product from MBT Maximize Out-of- Region Landfilling Local Landfilling of MBT Product C O 2e (to n n e/yr)

Net Particulate Emissions

Net PM2.5 Emissions

897 8,500 6,100 6,600 1,000 2,000 3,000 4,000 5,000 6,000 7,000 8,000 9,000 Large New WTE Out-of-Region Use of RDF Product from MBT Maximize Out-of- Region Landfilling Local Landfilling of MBT Product PM2.5 (kg/yr)

slide-28
SLIDE 28

28

MBT Staff Analysis

  • Staff analysis is that MBT pre-treatment does

not add value in terms of energy production, cost, greenhouse gas reductions and emissions

Q&A Q&A

slide-29
SLIDE 29

29

Managing the Remaining Waste

Comparing Landfills to Waste-to-Energy

Comparing Facilities

2008 Board resolution to compare facilities Retained AECOM, Sheltair, RWDI, Marvin Shaffer to

  • bjectively compare multiple alternatives

The analysis included:

  • new W TE facility in MV
  • new landfill outside MV
slide-30
SLIDE 30

30

Waste-to-Energy

Burnaby

Waste-to-Energy

Paris, France

slide-31
SLIDE 31

31

Waste-to-Energy

Brescia, Italy

Landfill

Cache Creek, BC

slide-32
SLIDE 32

32

Landfill

Cache Creek, BC

Net Energy Production

Performance Criteria: Energy Production

80,000 14,000 10,000 20,000 30,000 40,000 50,000 60,000 70,000 80,000 90,000 In-Region Waste-to-Energy Out-of-Region Landfill Waste Management Facilities (500,000 tonnes/yr) Energy Production (homes)

slide-33
SLIDE 33

33

Cost Comparison

Performance Criteria: Cost

1,500,000,000

  • 20,000,000
  • 200,000,000

200,000,000 400,000,000 600,000,000 800,000,000 1,000,000,000 1,200,000,000 1,400,000,000 1,600,000,000 1,800,000,000 In-Region Waste-to-Energy Out-of-Region Landfill Waste Management Facilities (500,000 tonnes/yr) Total 35 yr Net Cost 66

Net GHG Em issions Net GHG Em issions

Performance Criteria: Greenhouse Gases

123,000 127,000 20,000 40,000 60,000 80,000 100,000 120,000 140,000 160,000 180,000 200,000 In-Region Waste-to-Energy Out-of-Region Landfill Waste Management Facilities (500,000 tonnes/yr) GHGs (tonnes CO2e)

slide-34
SLIDE 34

34

Performance Criteria: Particulate Matter (2.5)

  • 2.4

1.5

  • 3.0
  • 2.5
  • 2.0
  • 1.5
  • 1.0
  • 0.5

0.0 0.5 1.0 1.5 2.0 In-Region Waste-to-Energy Out-of-Region Landfill Waste Management Facilities (500,000 tonnes/yr) PM 2.5

Net Particulate Emissions Net Particulate Emissions

68

Dioxins/Furans Dioxins/Furans

Canada’s permit levels are the most stringent in the world. Dioxin emissions from MV’s WTE facility are among the lowest in the world. From 1990-2005, actual dioxin emissions from WTE in US reduced by 99.7% (US EPA).

Performance Criteria: Dioxins & Furans

0.5 16.5 2 4 6 8 10 12 14 16 18 In-Region Waste-to-Energy Out-of-Region Landfill Waste Management Facilities (500,000 tonnes/yr) Dioxins & Furans (mg TEQ)

WTE Permitted amount: 250 mg TEQ/year

slide-35
SLIDE 35

35

Negative values for emissions indicate a net reduction, and for costs indicate net profit.

$1.5 billion

  • $20 million

Total 35 yr Net Cost 14,000 80,000 Energy Production (homes) 127,000 123,000 GHGs (tonnes CO2e) 16.5 0.5 Dioxins & Furans (mg TEQ) 0.2 18 Mercury (kg) 40 7.3 Ammonia (tonnes) 60

  • 155

VOCs (tonnes) 390

  • 240

CO (tonnes) 1.5

  • 2.4

PM2.5 (tonnes) 2.1

  • 2.4

PM10 (tonnes) 20

  • 80

SOx (tonnes) 95

  • 80

NOx (tonnes) Total Emissions per Year: Out-of-Region Landfill In-Region Waste-to-Energy Performance Criteria for Waste Management Facilities (500,000 tonnes/year)

Waste Management is a Minor Contributor to Emissions in Airshed

0.3% NH3 0.1% VOC 1.2% SOx 0.8% NOx 0.3% PM 2.5 % Pollutant

marine 7% all other sources 31% wood products 5% light & heavy- duty vehicles 4% construction 6% heating 20% burning 15% non-road 12% waste management 0.3%

2005 PM2.5 Emissions = 7,000 tonnes

  • pen
slide-36
SLIDE 36

36

Airshed Emissions from Solid Waste Management Scenarios (2020)

0.0 0.2 0.4 0.6 0.8 1.0 1.2 1.4 SOx NH3 NOx VOCs PM2.5 Contaminant Percent

Scenario 1 Scenario 2 Scenario 3 Scenario 4 Scenario 5 Scenario 6 Scenario 7 Scenario 8

Emissions from waste management are a small contributor to airshed totals in 2020 Emissions will be less than or comparable to present day

2005

Airshed Ozone Levels for 2020 Scenarios Compared to 2005

100% 86.14% 86.17% 86.19% 86.20% 86.16% 86.19% 86.27% 86.13% 0% 10% 20% 30% 40% 50% 60% 70% 80% 90% 100%

2005 Base Case 1 – Large New WTE 2 – Moderate New WTE 3 – In- Region Use

  • f RDF

Product from MBT 4 – Out-of- Region Use

  • f RDF

Product from MBT 5 – Waste Exported Out of Region to WTE 6 – Local Landfilling

  • f MBT

Product 7 – Maximize Local Landfilling 8 – Maximize Out-of- Region Landfilling

Scenario Maximum 8-hour Ozone Concentration (% of 2005 Base Case)

  • Ozone precursors going down, modelling predicts

improvements to 2020;

  • No discernible difference between scenarios
slide-37
SLIDE 37

37

Air Quality Comparison

$1.5 billion cost $20 million revenue Total 35 year Net Cost 86.13% 86.17% Regional ozone levels compared to 2005 Out of Region Landfill

(500,000 tonnes per year)

New WTEF in Region

(500,000 tonnes per year)

Scientific Consensus

The international scientific com m unity recognizes that m odern W TE is a safe and effective w aste m anagem ent technology.

The United Kingdom Health Protection Agency concluded, after years of analysis on the health impacts of WTE: “Since any possible health effects are likely to be very small, if detectable, studies of public health around modern, well managed municipal waste incinerators are not recommended.”

slide-38
SLIDE 38

38

Scientific Consensus

The international scientific com m unity recognizes that m odern W TE is a safe and effective w aste m anagem ent technology.

The United Kingdom Departm ent of Environm ent, Food and Rural Affairs: “Based on a review of over 600 publications, no link was discovered between living close to modern thermal treatment facility and adverse health impacts, including cancer and respiratory problems.”

Scientific Consensus

The international scientific com m unity recognizes that m odern W TE is a safe and effective w aste m anagem ent technology.

The US Environm ental Protection Agency reports: Between 1990 and 2005, actual emissions from waste to energy plants in the US have been reduced by 99.7% for dioxins, 97% for lead, 96% for mercury 96% for cadmium, and 96% for small particles.

slide-39
SLIDE 39

39

Scientific Consensus

The international scientific com m unity recognizes that m odern W TE is a safe and effective w aste m anagem ent technology.

The United Nations I ntergovernm ental Panel on Clim ate Change ( I PCC) has stated: “...there are no plausible scenarios in which landfilling minimizes GHG emissions from waste management”

78

Public Opinion Public Opinion Public Opinion

slide-40
SLIDE 40

40

80

30% 26% 1% 6% 32% 4% 37% 63%

1 2

Waste to Energy Other Landfill No Opinion Waste to Energy Landfill Other No Opinion

Metro Vancouver Fraser Valley

slide-41
SLIDE 41

41

WTE - Landfill Staff Analysis

  • Criteria used in the analysis were energy production,

cost, greenhouse gas reductions, ambient air quality and emissions

  • Waste-to-Energy is superior to Landfill on energy,

cost and greenhouse gas emissions

  • Waste-to-Energy is superior to Landfill on virtually all

emissions

  • There are no meaningful differences between any of

the waste management scenarios in terms of ambient air quality because they are such insignificant contributors

Q&A Q&A

slide-42
SLIDE 42

42

In or Out

  • f Region

Green River Burnaby

In-region is superior because of:

  • Lower cost for transportation
  • Higher revenues from district energy
  • Lower GHG emissions
  • Difference in local air quality is not discernible
  • Local management of remaining waste

WTE In-Region and Out-of-Region Staff Analysis

slide-43
SLIDE 43

43

Draft SWMP

Goal 3 : Recover Energy from the W aste Stream After Material Recycling Goal 4 : Dispose of all W aste in Landfill, After Material Recycling and Energy Recovery

Goal 3: Recover Energy from the Waste Stream After Material Recycling

  • Continue using the existing WTE facility in Burnaby
  • Increase WTE capacity in the region by up to 500,000 t/year

(replace Cache Creek Landfill)

  • Maximize energy recovery through district heat and electricity
  • Monitor trends in waste diversion and disposal and implement

additional WTE capacity only if justified by these trends

  • Scale any additional WTE capacity so that total capacity does not

exceed most probable minimum waste flow projection

  • Recover metals and ash for beneficial use
  • Recover landfill gas at the Vancouver Landfill and strive to use

beneficially

slide-44
SLIDE 44

44 Goal 4: Dispose of all Waste in Landfill, After Material Recycling and Energy Recovery

  • Utilize the Vancouver Landfill for any remaining waste not directed to

WTE subject to existing permits and agreements

  • Where existing permits and agreements work to the contrary of the

regional community, work in good faith to resolve

  • Establish contingency disposal at out-of-region landfills if capacity

within the region is insufficient

  • Ensure disposal capacity is available for DLC waste

SWMP Costs

$ 1 3 8 $ 4 3 2 $ 1 5 .1 Total Current Practice $ 1 4 7 $ 4 9 4 $ 1 7 .3 Total Proposed SWMP $119 $300 $10.5

Disposal (with MBT facility):

$83 $220 $7.7

Disposal (proposed SWMP):

$94 $243 $8.5

Disposal (landfill emphasis):

$64 $274 $9.6

Recycling (70% diversion):

$44 $189 $6.6

Recycling (55% diversion): Annual Cost Per Household ( $ ) Total Annual Cost ( $ m illion) Total Cost Over 3 5 Years ( $ billion) Costs for W aste Managem ent

slide-45
SLIDE 45

45

Discussion Discussion