
1
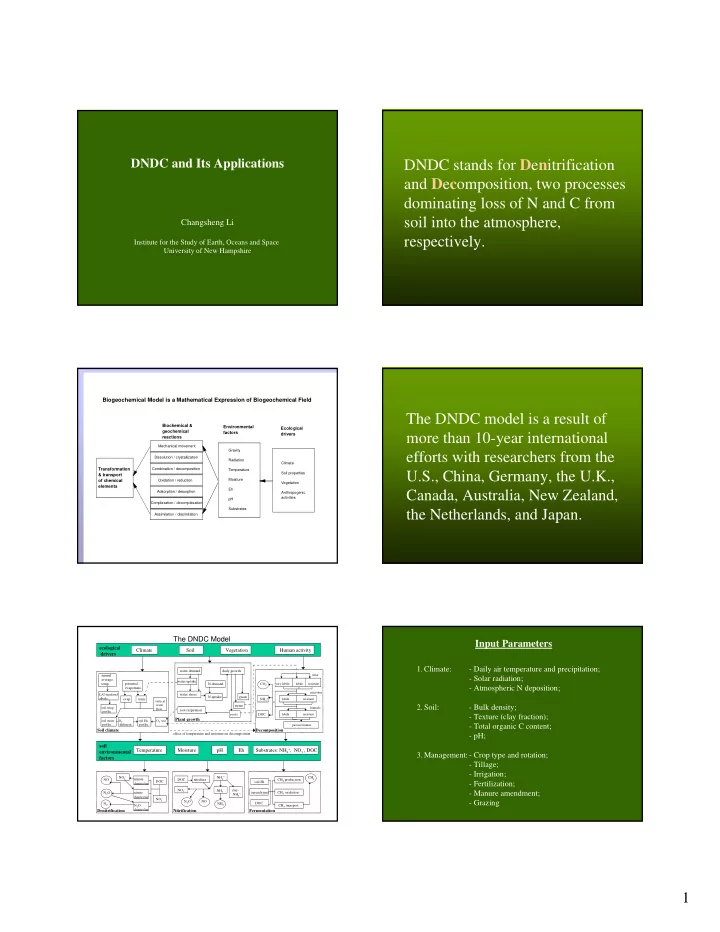
DNDC and Its Applications
Changsheng Li
Institute for the Study of Earth, Oceans and Space University of New Hampshire
DNDC stands for Denitrification and Decomposition, two processes dominating loss of N and C from soil into the atmosphere, respectively.
Transformation & transport
- f chemical
elements
Mechanical movement Dissolution / crystallization Combination / decomposition Oxidation / reduction Adsorption / desorption Complexation / decomplexation Assimilation / dissimilation Gravity Radiation Temperature Moisture Eh pH Substrates Climate Soil properties Vegetation Anthropogenic activities
Biochemical & geochemical reactions Environmental factors Ecological drivers
Biogeochemical Model is a Mathematical Expression of Biogeochemical Field
The DNDC model is a result of more than 10-year international efforts with researchers from the U.S., China, Germany, the U.K., Canada, Australia, New Zealand, the Netherlands, and Japan.
The DNDC Model
ecological drivers Climate Soil Vegetation Human activity soil environmental factors Temperature Moisture pH Substrates: NH4
+, NO3
- , DOC
Eh
Denitrification Nitrification Fermentation Decomposition Plant growth Soil climate
NH4
+
clay- NH4
+
NH3 DOC nitrifiers NO3
- N2O
NO NH3 DOC NO3
- NO
N2O N2 NO2
- nitrate
denitrifier nitrite denitrifier N2O denitrifier CH4 CH4 production CH4 oxidation CH4 transport soil Eh aerenchyma DOC soil temp profile soil moist profile soil Eh profile O2 diffusion O2 use vertical water flow very labile labile resistant litter labile resistant labile resistant microbes humads passive humus CO2 DOC NH4
+
roots stems grain N-demand N-uptake water demand water uptake water stress daily growth root respiration potential evapotrans. LAI-regulated albedo evap. trans. effect of temperature and moisture on decomposition annual average temp.
Input Parameters
- 1. Climate:
- Daily air temperature and precipitation;
- Solar radiation;
- Atmospheric N deposition;
- 2. Soil:
- Bulk density;
- Texture (clay fraction);
- Total organic C content;
- pH;
- 3. Management:- Crop type and rotation;
- Tillage;
- Irrigation;
- Fertilization;
- Manure amendment;
- Grazing.