street trees and california s changing climate what to
play

Street Trees and Californias Changing Climate: What to expect, and - PowerPoint PPT Presentation

Street Trees and Californias Changing Climate: What to expect, and how to prepare University Avenue, Palo Alto, CA Life Among the Leaves 2017 CAUFC Annual Conference Joe R. McBride and Igor Lacan Department of Landscape


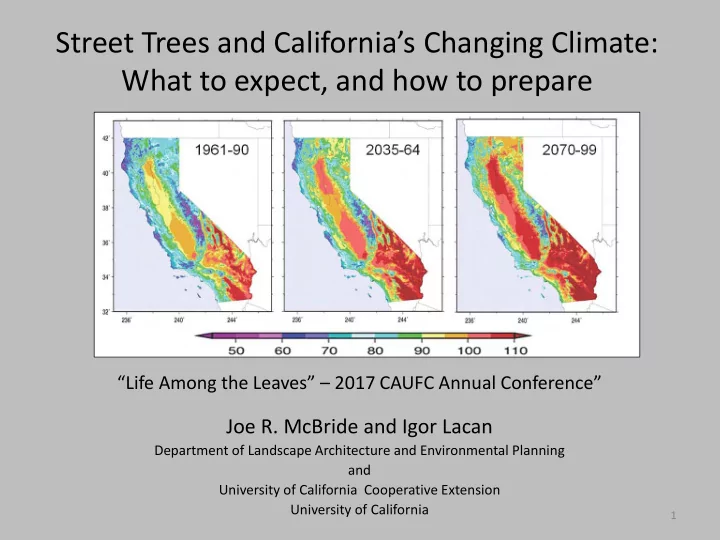
  1. Street Trees and California’s Changing Climate: What to expect, and how to prepare University Avenue, Palo Alto, CA “Life Among the Leaves” – 2017 CAUFC Annual Conference” Joe R. McBride and Igor Lacan Department of Landscape Architecture and Environmental Planning and University of California Cooperative Extension University of California 1

  2. 2

  3. Problem Facing California’s Urban Forests Increasing Temperature – San Rafael from: Cal-adapt.org San Rafael, CA July Ave. Max. Temperature ( o F) Historic Predicted 79.8 o 85.6 o 3

  4. Problem Facing California’s Urban Forests Increasing Temperature – Yuba City, CA from: Cal-adapt.org Yuba City, CA July Ave. Max. Temperature ( o F) Historic Predicted 93.5 o 106.7 o 4

  5. Change in Precipitation Santa Monica (13.2”-> 10.0”) Yuba City (20.5”-> 19.5”) Susanville (11.9”-> 14.0”) Burbank (17.3”-> 13.5”) Eureka (40.3” -> 45”) Riverside (10.3”-> 8.3”) from: Cal-adapt.org 5

  6. Change in Snowpack 1950 2090 “By the end of this century, the Sierra snowpack is projected to experience a 48-65 percent loss from the historical April 1st average. This loss of snowpack means less water will be available for Californians to use.” California Department of Water Resources 6 (2015) .

  7. Objective 1. Identify the anticipated impacts on street trees by climate change 2. Describe the physiological consequences of increasing temperature and decreasing available moisture 3. Report on a project to identify California street trees that will most likely be impacted by climate change 4. Suggest ideas for management actions today, in the next few years, and in the coming decades 7

  8. What Impacts on Street Trees can we expect as a result of Climate Change? 8

  9. 9

  10. Water Deficit Injury Water deficit symptoms range from wilt to tree death.

  11. Management implications: Consider providing water ahead of (or during) hot spells 11

  12. Leaf necrosis Leaf drop and stem dieback

  13. 13

  14. 14

  15. Physiological Consequences of Increasing Temperatures 15

  16. Photosynthesis and Temperature Photosynthesis CO Assimilation 2 Temperature 16

  17. Respiration and Temperature CO Production Respiration 2 Temperature 17

  18. Photosynthesis, Respiration, and Temperature Photosynthesis CO Assimilation/Production Respiration 2 95 o F 115 o F Temperature 18

  19. Temperature and Tree Growth Optimum Growth rate Minimum Maximum Temperature 19

  20. Variation among Species Birch Oak Olive Growth Rate Temperature 20

  21. Impact of Higher Temperature Current Temperature Range Future Temperature Range 21

  22. Physiological Consequences of Decreasing Available Moisture 22

  23. Drought and tree physiology: problems… Trees need water to “feed themselves” (photosynthesis) ~ Drought effect # 1 = reduction in growth (which may persist) ~ Drought effect # 2 = less stored energy  lowered plant defenses  facilitates insects, and diseases Sufficient water Water-stressed Water deficit reduces growth rate and causes undersized leaves and shoots.

  24. Drought and tree physiology: problems… ~ Next year’s leaves are made today - growth reduction may persist for at least one year after the drought is over! Watson and Himelick, 2013

  25. Drought and tree physiology: problems… ~ With enough water: trees can recover, but that may take multiple years ~ With continued lack of water: carbon starvation, and premature death Management implications: Don’t panic (that the recovery is not as fast as we would like), but do keep providing water (if available), Watson and Himelick, 2013 and make a plan for getting through the next drought

  26. Impact of Water Stress on Physiological Processes Transpiration Photosynthesis Respiration 150 Percent of Process 100 50 - 10 - 20 - 30 - 40 Leaf Water Stress (bars) 26

  27. Variation among Species Olive Oak Birch Growth Rate Available Moisture 27

  28. Impact of Less Water Current Moisture Range Future Moisture Range 28

  29. Identification of California street trees that will most likely be impacted by climate change 29

  30. Method Application of a method used by plant ecologists to study plant succession. This method is called “ substitution of space for time”. 30

  31. “substitution of space for time” Temperature o F Current Ave. Predicted Ave. July Max. July Max. Fresno 95 108 El Centro 106 • Fresno • El Centro 31

  32. Urban Forest Composition Fresno El Centro D F H A B C E C A G Conclusion: Three of the common street trees in Fresno (B, D, E) will not perform well in Fresno when the temperature of Fresno becomes as warm as the temperature in El Centro. 32

  33. Steps in the Method “substitution of space for time” 1. Select an example city for each of the 16 climate zones in California 2. Select a comparison city (“warm” city) for each example city that currently has an average maximum July temperature that the example city will have in 2099 3. Compare the common species in the example city to the tree species in its comparison city (“warm” city) and to all other cities that are warmer that its comparison city 33

  34. Climate Zones Cities and Towns 14 34

  35. Selection Criteria for Example Cities within each Climate Zone 1. Temperature near average for cities in climate zone 2. Size of City large enough to have ‘ample’ street tree population 3. Geographic Location typical of the climatic zone 35

  36. Cities Selected as Example Cities 14 36

  37. Example Cities for the 16 California Climate Zones Berkeley, California 4 1 2 3 6 7 8 5 12 11 10 9 Susanville, California Susanville 16 15 13 14 37

  38. Steps in the Method “substitution of space for time” 1. Select an example city for each of the 16 climate zones in California 2. Select a comparison city for each example city that currently has an average maximum July temperature that the example city will have in 2099. 3. Compare the common species in the example city to the tree species in its comparison city and to all other cities that are warmer that its comparison city 38

  39. Historic July Average Maximum Temperatures 39

  40. Predicted Weather Data 40

  41. Predicted July Average Maximum Temperatures 41 from : http://cal-adapt.org/temperature/annual/

  42. Historic and Predicted July Average Maximum Temperatures 42 from : http://cal-adapt.org/temperature/annual/

  43. Selection of Comparison Cities 43 from : http://cal-adapt.org/temperature/annual/

  44. Selection of Comparison Cities ? 44 from : http://cal-adapt.org/temperature/annual/

  45. Furnace Creek Average July Maximum Temperature = 116 o F 45

  46. Example Cities and Comparison Cities 46

  47. Steps in the Method “substitution of space for time” 1. Select an example city for each of the 16 climate zones in California 2. Select a comparison city for each example city that currently has an average maximum July temperature that the example city will have in 2099. 3. Compare the common species in the example city to the tree species in its comparison city and to all other cities that are warmer that its comparison city 47

  48. Street Tree Survey From: C. M. Highsmith 48

  49. Street Tree Survey – Santa Ana Locations of Sample Plots (10 x 10 grid) Santa Ana: 59 grid points fall in the city 50 of these were selected at random for sampling 49

  50. Sample Location Grid line intersection • Sample Location (Nearest street Intersection) 50

  51. Arrangement of Sample Plots North Plots 10’ East Plots 100’ • West Plots South Plots 51

  52. McBride and Lacan off to survey the street trees of California 52

  53. Number of Tree Species 53

  54. Most Common Species in each Example City 1 2 4 3 Purple Leaf Plum London Plane Tree Sweetgum London Plane Tree (Eureka) (Ukiah) (Berkeley) (King City) 6 7 5 8 Southern Magnolia Moreton Bay Fig Mexican Fan Palm London Plane Tree (Santa Maria) (Santa Monica) (San Diego) (Santa Ana) 10 9 11 12 Crape Myrtle Mexican Fan Palm Redwood London Plane Tree (Burbank) (Riverside) (Yuba City) (Stockton) 16 14 15 13 Crape Myrtle White Mulberry Silver Wattle Siberian Elm (Fresno) (Barstow) (El Centro) (Susanville) 54

  55. Climate Zone 3 Example City = Berkeley; “Warm” City = Santa Ana Berkeley, California July Average Max. Temp ( o F) City Historic Predicted Berkeley 70.3 80.4 Santa Ana 82.3 86.9 55

  56. Common Berkeley street trees and their occurrence in Santa Ana

Download Presentation
Download Policy: The content available on the website is offered to you 'AS IS' for your personal information and use only. It cannot be commercialized, licensed, or distributed on other websites without prior consent from the author. To download a presentation, simply click this link. If you encounter any difficulties during the download process, it's possible that the publisher has removed the file from their server.

Recommend


More recommend