
SLIDE 1
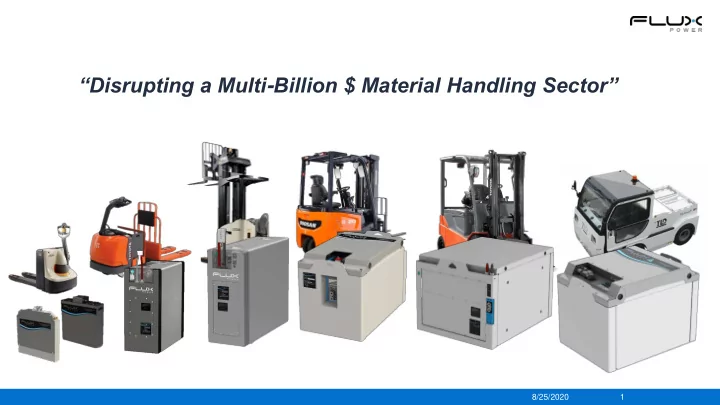
“Disrupting a Multi-Billion $ Material Handling Sector”
8/25/2020 1
Disrupting a Multi - Billion $ Material Handling Sector 8/25/2020 1 - - PowerPoint PPT Presentation
Disrupting a Multi - Billion $ Material Handling Sector 8/25/2020 1 Safe Harbor Language Forward Looking Statements: This presentation contains forward-looking statements. All statements other than statements of historical fact contained
8/25/2020 1
This presentation contains forward-looking statements. All statements other than statements of historical fact contained in this presentation, including statements as to the Company’s future results of operations and financial position, planned products and services, business strategy and plans and objectives of management for future
Company’s actual results, performance or achievements to be materially different from any future results, performance or achievements expressed or implied by the forward-looking statements. In some cases, you can identify forward-looking statements by terms such as “may,” “will,” “should,” “expects,” “plans,” anticipates,” “could,” “intends,” “target,” “projects,” “contemplates,” “believes,” “estimates,” “aims,” “predicts,” ”potential,” “seeks,” attempts,” “poised“ or “continues” or the negative of these terms
projections about future events and financial trends that it believes may affect its business, financial condition and results of operations. Also, these forward-looking statements represent the Company’s estimates and assumptions only as of the date of this presentation. The Company assumes no obligation to update any forward- looking statements after the date of this presentation. This presentation also contains estimates and other statistical data made by independent parties and by the Company relating to market size and growth and other industry data. These data involve a number of assumptions and limitations, and you are cautioned not to give undue weight to such estimates. The Company has not independently verified the statistical and other industry data generated by independent parties and contained in this presentation and, accordingly, it cannot guarantee their accuracy or completeness. In addition, projections, assumptions and estimates of its future performance and the future performance of the industries in which it operates are necessarily subject to a high degree of uncertainty and risk due to a variety of factors. These and other factors could cause results to differ materially from those expressed in the estimates made by independent parties and by the Company. 8/25/2020 2
8/25/2020 3
Flux Power LiFT Pack ISO 9001 Certified Assembly Facility in Vista, CA
Enabling the paradigm shift to an electrified world for material handling
extensions including solar energy storage for electric vehicle (EV) charging and warehouse robotics
Early Stages of Multi-Billion Dollar Market Opportunity
and no water maintenance versus legacy lead acid batteries
Market Validation with Fortune 500 Customers
Delta Air Lines
High Growth with Margins Expanding
~$16.8M; rapid growth anticipated to continue with impact of full product line rollout and high sector growth
8/25/2020 4
*Company estimates based on Industrial Truck Association (ITA), Sept 2019 Annual Publication; comparisons reflect feedback from customers
8/25/2020 5
8/25/2020 6
that ~260,000 lift trucks were sold in North America in 2018
trucks; 40% of forklift sector is internal combustion (primarily propane)
propane (IC) to lithium-ion to address environment and maintenance issues
share
easily with most forklifts for lead acid replacement business
8/25/2020 7
Sit-on Narrow Aisle Walkie End Rider
Forklift Type Class Description
Electric Trucks Class 1 Sit-on / Counterbalance Class 2 Narrow Aisle Class 3 Walkie Pallet Class 3 End Riders / Center Riders Internal Combustion (IC) Trucks Class 4 IC, Solid Tires Class 5 IC, Pneumatic Tires Tractors / Rough Terrain Trucks Class 6 Electric and IC Tractor / Trailers Class 7 Rough Terrain Forklift Trucks
Sector focus
*OSHA Classifications IC includes: propane, gasoline, diesel,
Potential conversion
8/25/2020 8
Attribute Lead Acid Batteries Flux Power Lithium-Ion “LiFT Packs” Performance Power & runtime Limitations Run longer shifts, maintain power Lifespan * Shorter cycle life 5 – 10 year warranties Efficiency ** Less efficient energy storage More efficient energy usage than lead acid Maintenance *** Must water; requires multiple packs/truck Single pack/truck,
Environmental Acid; produces
charge Environmentally sealed for life, no risk of spills Cost Lower initial purchase cost Lower total cost of
Performance Safety Maintenance Environmental Impact Energy Efficiency
Flux Power LiFT Packs eliminate forklift operation pain points, with lower total cost of ownership
* Lithium-ion has 7-year life, Argonne National Labs Study ** Lithium chemistry wastes less energy per Battery University *** Requires no water maintenance
8/25/2020 9
Battery Costs
Lead-Acid M-Series Net
Price per Battery 4,000 $ 12,000 $
Savings
Expected lifetime (years) 6 10 Batteries per unit 2 1 Total batteries in 5 years 1.7 0.5 Number of Trucks in fleet 10 10
Total 5-Year Battery Cost
66,667 $ 60,000 $ 6,667 $
Operating Costs
Watering System Cost 300 $
H2O Maintenance (mins/wk/bat) 2 H2O Maintenance Rate ($/Hr) 60 $
Staff Labor Rate ($/ Per Hour) 20 $
Change-out time (mins) 5 Change outs/week/truck 7 Total Staff Labor-hrs/week 6
Total 5-Year Operation
36,167 $
36,167 $
Energy Savings
Energy Cost (kWh) $0.14 Efficiency Gain 40% Battery Voltage (V) 36 Battery Capacity (Ah) 400 8 hour shifts per week 14
Total 5-Year Cost
51,368 $ 30,821 $ 20,547 $
Metric Tons of CO2 Saved: 109
Warehouse Space
Cost per square foot per month $0.30 Square footage saved 800
Total 5-Year Cost
14,400 $
14,400 $
5-Year Total
168,601 $ 90,821 $ 77,780 $
Annualized Total
33,720 $ 18,164 $
15,556 $
Percent Savings vs Lead Acid
8/25/2020 10
Percent Savings vs Lead Acid
Battery Costs
Lead-Acid L/X-Series Net
Price per Battery 6,500 $ 22,000 $
Savings
Expected lifetime (years) 5 7 Batteries per unit 3 1 Total batteries in 5 years 3.0 0.7 Number of Trucks in fleet 80 80
Total 5-Year Battery Cost
1,560,000 $ 1,257,143 $ 302,857 $
Operating Costs
Watering System Cost 300 $
H2O Maintenance (mins/wk/bat) 11 H2O Maintenance Rate ($/Hr) 60 $
Staff Labor Rate ($/ Per Hour) 35 $
Change-out time (mins) 22 Change outs/week/truck 21 Total Staff Labor-hrs/week 616
Total 5-Year Operation
5,843,100 $
5,843,100 $
Energy Savings
Energy Cost (kWh) $0.08 Efficiency Gain 50% Battery Voltage (V) 36 Battery Capacity (Ah) 600 8 hour shifts per week 19
Total 5-Year Cost
478,034 $ 239,017 $ 239,017 $
Metric Tons of CO2 Saved: 2,223
Warehouse Space
Cost per square foot per month $0.30 Square footage saved
Total 5-Year Cost
5-Year Total
7,881,134 $ 1,496,160 $ 6,384,974 $
Annualized Total
1,576,227 $ 299,232 $
1,276,995 $
8/25/2020 11
Equipment Flux Power Product Description
Class 3 Walkie S8 & S24 LiFT Pack
High volume workhorse
Class 3 End / Center Rider M24 LiFT Pack
Market volume similar to Walkies 4X energy of Walkie
Class 2 Narrow Aisle M36 LiFT Pack
Narrow Aisle, High Growth 10X energy of Walkie
Class 1 3-Wheel & Class 2 Turret Truck L48 LiFT Pack
8X energy of Walkie
Class 1 Counterbalanced X-Series LiFT Pack
12X energy of Walkie
Airport GSE GSE Pack
Modular design similar to Class 1 14X energy of Walkie
Other Industrial Applications Solar Storage, AGV, etc. C-Series
Lowest $/kWh product 2-6X energy of Walkie
8/25/2020 12
Launched 2018-19 and Fits Most Models d fits Launched 2014
Battery “Tier” Class 2 Narrow Aisle Ground Support Equipment Class 1 Ride-On Class 3 End Rider Class 3 Walkie 1.7 to 4.3 kWh 16 to 48 kWh 21.6 to 32 kWh 21.6 to 31 kWh 9.6 to 14.4 kWh
Lithium Iron Phosphate cells (no Cobalt)
2-Tier Blade (GSE/Class 1) 3-Tier Pack (Class 2/Class 3) 1-Tier Pack (Class 3)
8/25/2020 13
Data is sent to telematic units Data is transmitted via cellular / Wi-Fi connection Data is stored in a cloud base Data is translated and a portfolio
customer / dealer / Flux Power Fleet Dashboard Weekly / Monthly Report Battery ‘Deep Dive’
customer
massive data expansion
Dealer, or Flux Power support personnel
(power as a service) sales models
Alerts via text / email lets users know when a charge is needed
natural product extension to forklift applications
continue pacing
in adopting new technology
their new equipment sales
Seattle), along with initial sales to global GSE service provider
8/25/2020 14
8/25/2020 15
customer experience
investment
Dec 2020
safety and durability
quality, including repeatable, reliable processes subject to annual certification
8/25/2020 16
8/25/2020 17
8/25/2020 18
8/25/2020 19
8/25/2020 20
0% 5% 10% 15% 20% 2 4 6 8 10 12 14 16 18 FY 2018 FY 2019 FY 2020
$ Millions
Revenue Gross Margin
16.5 GM
12.9% (FY20 Q3)
Gross Margin
5.9%
Income Statement For the Fiscal Period Ending FQ4/CQ2 FQ1/CQ3 FQ2/CQ4 FQ3/CQ1 ($ Millions) Jun 30, 2019 Sep 30, 2019 Dec 31, 2019 Mar 31, 2020 Total Revenue 3.0 1.9 3.6 5.1 Cost Of Goods Sold 2.8 1.8 3.3 4.4 Gross Profit 0.2 0.1 0.3 0.6 Gross Profit % 6.7% 6.1% 9.0% 12.8% Selling General & Admin 2.2 2.2 2.2 2.6 R&D Exp 1.2 1.4 1.0 1.5 Other Operating Exp., Total 3.4 3.6 3.3 4.1 Operating Income
Net Interest Exp.
Net Income
4.1 9.3
8/25/2020 21
Note: Currently have progression of improving gross margin with long-term goal > 30%
Initiatives for gross margin improvement Explanation
Next-Gen Battery Management System (BMS) Consolidates PCBs; modular design to accommodate large packs Cell sourcing & purchasing improvements New cell supplier has automated factory for better quality & cost Volume & sourcing efficiencies Higher purchasing will lower unit costs Assembly efficiencies & utilization Continuous improvement of production line efficiencies Unit pricing from new features/options Adds: heater options, telemetry options, weight, dimensions Achieve most of goal within 12 months All initiatives now underway
8/25/2020 22
Impact of Recent PIPE and Debt Conversion FY 2020 Qtr 3 Change Comment ($000) ($000) Assets Cash 106 4,300 PIPE raise closed July 24, 2020 Accts Rec 2,710 Inventory 5,139 Other Current 916 Other LT 2,894 Total Assets 11,765 Liabilities Accts Payable 4,141 Other current 2,076 Other LT 4,853 LOC debt 13,455 (8,300) Debt conversion closed June 30 and July 24 Total Liab. 24,525 Equity (12,760) 12,600 Increased Equity Total Liab & Eq. 11,765
8/25/2020 23
*$Short-term notes. No long-term debt.
8/25/2020 24
Ron Dutt: CEO, Director
Leadership at DHL, Ford Motor Company, Visa, Directed Electronics and SOLA Int’l. Led companies from early stage to >$1B rev.
Paulus Geantil: CTO
Expert in embedded systems, electrical design, robotics, & system integration and has patents across various technologies.
Jon Berry: COO
Senior roles at Alstom Transport, PACCAR UK, Clean Air Power and Pilkington Aerospace.
Sweden assembly line.
Tod Kilgore: Director of Sales
Led sales organization at Samina Corporation, Accurate Solutions, Amistar Manufacturing and Marshall Industries.
Chuck Scheiwe: CFO
Led accounting and financial planning operations of diverse companies, Senstay Reptron & Teletrac and GreatCall, from startup stage to high growth
Tim Vaughan: Director of Engineering
Experienced automation and process improvement Engineer, including medical and aerospace industries with John Deere & Veridiam.
8/25/2020 25
8/25/2020 26
64,000 sq. ft. facility in Vista, CA