
SLIDE 1
1
Olivia I. Okereke, MD, SM
Associate Professor of Psychiatry and Epidemiology, Harvard Medical School and Harvard T. H. Chan School of Public Health Director of Geriatric Psychiatry, Massachusetts General Hospital NAMS Plenary September 26, 2019
Vitamin D and Omega‐3 Fatty Acids: Do They Have Benefits for Mood, Depression,
- r Cognition?
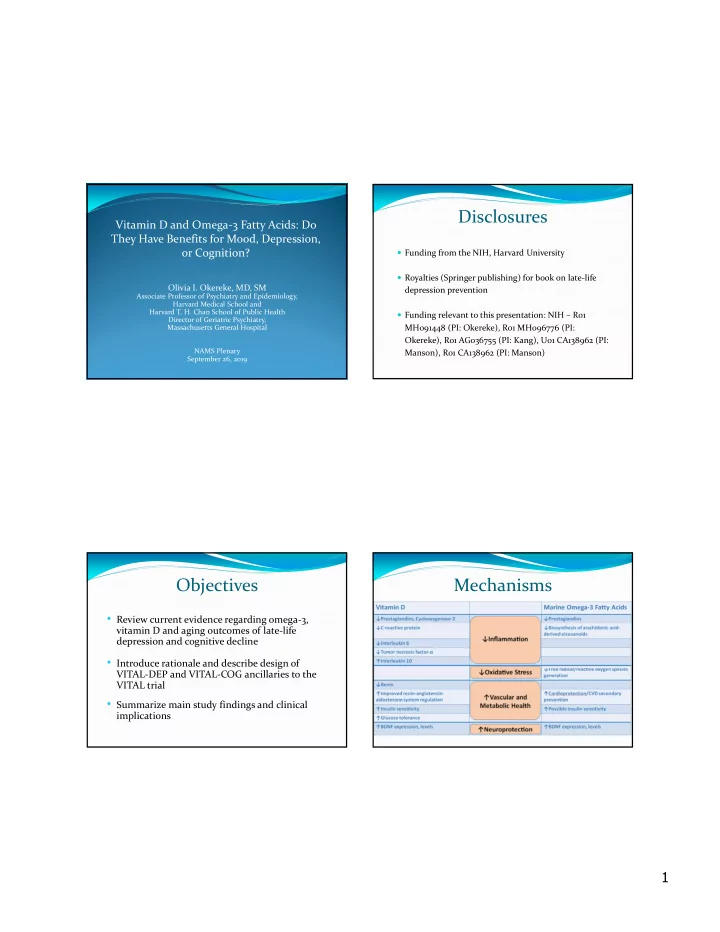
Disclosures
Funding from the NIH, Harvard University Royalties (Springer publishing) for book on late‐life depression prevention Funding relevant to this presentation: NIH – R01 MH091448 (PI: Okereke), R01 MH096776 (PI: Okereke), R01 AG036755 (PI: Kang), U01 CA138962 (PI: Manson), R01 CA138962 (PI: Manson)
- Review current evidence regarding omega‐3,
vitamin D and aging outcomes of late‐life depression and cognitive decline
- Introduce rationale and describe design of
VITAL‐DEP and VITAL‐COG ancillaries to the VITAL trial
- Summarize main study findings and clinical