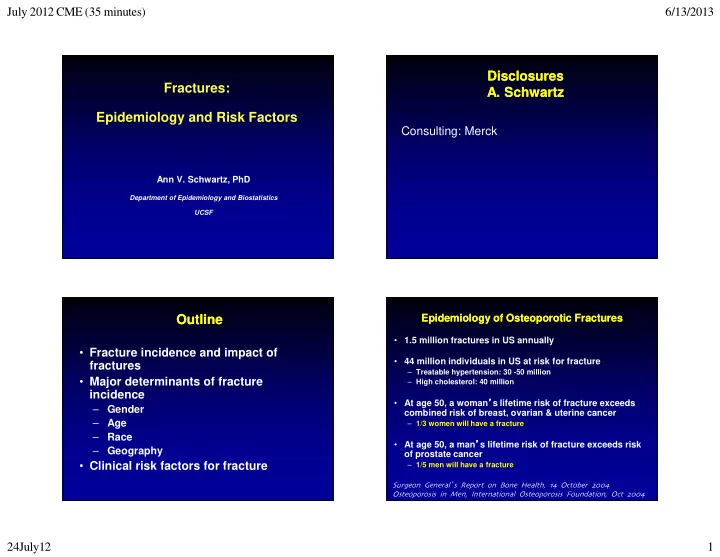
disclosures disclosures fractures a schwartz a schwartz
play

Disclosures Disclosures Fractures: A. Schwartz A. Schwartz - PowerPoint PPT Presentation

July 2012 CME (35 minutes) 6/13/2013 Disclosures Disclosures Fractures: A. Schwartz A. Schwartz Epidemiology and Risk Factors Consulting: Merck Ann V. Schwartz, PhD Department of Epidemiology and Biostatistics UCSF Epidemiology of


  1. July 2012 CME (35 minutes) 6/13/2013 Disclosures Disclosures Fractures: A. Schwartz A. Schwartz Epidemiology and Risk Factors Consulting: Merck Ann V. Schwartz, PhD Department of Epidemiology and Biostatistics UCSF Epidemiology of Osteoporotic Fractures Epidemiology of Osteoporotic Fractures Outline Outline • 1.5 million fractures in US annually • Fracture incidence and impact of • 44 million individuals in US at risk for fracture fractures – Treatable hypertension: 30 -50 million • Major determinants of fracture • At age 50, a woman ’ ’ ’ s lifetime risk of fracture exceeds ’ – High cholesterol: 40 million incidence – Gender combined risk of breast, ovarian & uterine cancer – Age • At age 50, a man ’ ’ s lifetime risk of fracture exceeds risk ’ ’ – 1/3 women will have a fracture – Race – Geography of prostate cancer • Clinical risk factors for fracture – 1/5 men will have a fracture Surgeon General ’ s Report on Bone Health, 14 October 2004 Osteoporosis in Men, International Osteoporosis Foundation, Oct 2004 24July12 1

  2. July 2012 CME (35 minutes) 6/13/2013 Overall incidence of fractures Overall incidence of fractures Common sites of fracture Common sites of fracture Annual incidence (rate/1000) Johansen et al, 1997 Men Spine 80 Women 60 Hip 40 20 0 0 20 40 60 80 Wrist Age (years) Hip fractures are associated 5-year Risk of Fracture: 5-year Risk of Fracture: with increased morbidity and mortality Role of Age and Sex Role of Age and Sex Men Women 20% No longer able to live independently 5 year fracture risk 15% 50% Unable to walk Hip independently 40% Permanent Hip 10% disability Vertebrae Vertebrae Death within 30% one year 5% 20% Wrist Wrist 35–39 > 85 > 85 • Direct costs: > $10 billion / yr Age Group, yr – Cost of hip fracture > $80,000 per person Cooper C et al. J Bone Miner Res 1992 Cooper C. Am J Med. 1997;103(2A):12S–17S. 24July12 2

  3. July 2012 CME (35 minutes) 6/13/2013 Impact of Vertebral Impact of Vertebral Prospects for the Future ... Prospects for the Future ... Fractures Fractures • 20% excess mortality in 5 yrs • Elderly represent fastest growing segment of population after fracture • Deformity & height loss • By 2020, one-half of US citizens older than 50 will be at • Acute & chronic pain risk for fractures from osteoporosis • Pulmonary dysfunction • Diminished quality of life: loss of self-esteem, distorted body image, dependence on narcotic analgesics, sleep disorder, depression, loss of independence Worldwide Distribution of Hip Worldwide Distribution of Hip World Population: 1990 and 2025 World Population: 1990 and 2025 Fractures in Women: 1990 to 2050 Fractures in Women: 1990 to 2050 Age range (years) 80+ 1990 71-75 Men Women Hip Fractures, x1000 61-65 3000 1990 51-55 41-45 2500 2025 31-35 21-25 2050 2000 11-15 0-5 1500 80+ 2025 1000 71-75 61-65 500 51-55 41-45 0 31-35 Women Women 21-25 Mid East, Asia, 11-15 N. Am, Europe 0-5 Latin Am, Africa 300 200 100 0 100 200 300 Number (000,000) 24July12 3

  4. July 2012 CME (35 minutes) 6/13/2013 Rates of hip fracture vary Rates of hip fracture vary Geographic Variation — Lifetime Geographic Variation — Lifetime dramatically by region and country dramatically by region and country Risk of Hip Fracture at Age 50 yrs Risk of Hip Fracture at Age 50 yrs Turkey Women Men China Hungary China (HK) Portugal Greece Spain France Finland Japan UK Canada Germany Netherlands USA Denmark Italy Australia Iceland Switzerland Norway Sweden 0 5 10 15 20 25 0 5 10 LTR (years) Less variation in prevalence of ‘ Less variation in prevalence of ‘ ‘ ‘ ‘ vertebral ‘ ‘ ‘ vertebral fractures ’ fractures ’ ’ by standard definitions ’ ’ ’ by standard definitions ’ ’ Lifetime risks of clinical fractures Lifetime risks of clinical fractures 50 year old white women (U.S.) 50 year old white women (U.S.) Lifetime risk* • Hip fracture 17% • Wrist fracture 16% • Vertebral fracture 16% • Any fracture > 50% Breast cancer 15% *Refs: Melton; Black; Kanis 24July12 4

  5. July 2012 CME (35 minutes) 6/13/2013 Osteoporosis in Men Osteoporosis in Men Lifetime risks of fracture: Lifetime risks of fracture: Impact of gender Impact of gender • 1/5 men over age 50 will suffer osteoporotic fracture Lifetime Risk at Age 50* Fracture Men (%) Women (%) • 30% of hip fractures worldwide Hip 6 17 are in men Wrist 3 16 Clinical Vert Fx 5 16 • Mortality rates due to fracture higher in men than women Any 16% > 50% • Treatment rates following * Among Caucasians fracture are abysmal Race and rate of hip fractures Race and rate of hip fractures Outline Outline (age adjusted to U.S.) (age adjusted to U.S.) • Fracture incidence and impact of Race Female Male fractures Caucasian (US) 968 396 • Major determinants of fracture Black (US) 214 179 incidence Hispanic (US) 219 97 – Gender Asian US (California) 383 116 – Age – Race Japan 227 79 – Geography Hong Kong 389 196 Beijing 97 101 • Clinical risk factors for fracture Luz Villa, Osteoporosis, 2001. Rates per 100,000 person-years, age-adjusted 24July12 5

  6. July 2012 CME (35 minutes) 6/13/2013 Age and BMD Are Independent Risk Factors for Age and BMD Are Independent Risk Factors for Combining BMD with Clinical Risk Factors Combining BMD with Clinical Risk Factors Hip Fracture (more later, S. Harris) Hip Fracture (more later, S. Harris) Age (yrs) 20 80 30 > 5-fold increase in (per 1000 woman-years) 25 fracture probability 70 Hip Fx Rate 20 from age 50 to 80 15 10 10 60 5 50 0 >=5 Lowest 3-4 Middle 0 Third # Risk Factors Highest Third 0-2 -3 -2 -1 0 1 Heel BMD Third Hip BMD T-score (SD) Kanis et al, 2004 Cummings et al., NEJM 332(12):767-773, 1995 Combining Risk Factors for Combining Risk Factors for WHO Risk Model (FRAX): Overview WHO Risk Model (FRAX): Overview Osteoporosis Osteoporosis • In heart disease, risk factors (e.g. BP, lipids, • To be discussed by Dr. Harris smoking) play independent role – Risk factor models and tools are in common • Based on 10 year risk of hip or major clinical fracture clinical use BMD doesn ’ ’ ’ ’ t tell the whole story and that • Combine observational studies from around the world • In osteoporosis, growing realization that to define a set of robust risk factors. With and without BMD other risk factors play important (and • Make country-specific risk-based diagnostic and independent) role treatment thresholds based on local considerations – T-scores alone are problematic • Develop systems for estimating risk based on multiple risk factors 24July12 6

  7. July 2012 CME (35 minutes) 6/13/2013 Vertebral fractures indicate a very Vertebral fractures indicate a very Risk factors in WHO FRAX calculator Risk factors in WHO FRAX calculator high risk of future fracture high risk of future fracture • Age, gender, race, geography • BMD • 4x risk of more vert fxs • Previous fracture • 2x risk of other fractures • Parent fractured hip ( vanStaa, Osteop Int 2002 ) • Body Mass Index (BMI) (weight/height 2 ) • Current smoking • Women with clinical • Glucocorticoids diagnosis of vertebral • Rheumatoid arthritis fracture have 5-15% 5 yr • Alcohol 3+ drinks/day hip fracture risk! • Secondary osteoporosis (if BMD not included) Not in FRAX Effect of prevalent radiographic vertebral Effect of prevalent radiographic vertebral Existing Vertebral Fracture Predictive of Existing Vertebral Fracture Predictive of fracture on non-vertebral fracture risk fracture on non-vertebral fracture risk Future Vertebral Fracture Independent of BMD Future Vertebral Fracture Independent of BMD No vert fx Absolute fracture risk (%) >1 vert fx 6 5.8 Previous 3.4 5 Vert Frx Low BMD 2.3 4 Mid BMD 3 High BMD 1.7 2 No Vert Frx 1.0 1 0.2 0 -2 -3 -4 0 1 2 3 4 5 6 Femoral neck T-score Risk of New Vertebral Fractures (% / yr) Ross 1991 Siris et al, Osteop Int 2007 24July12 7

  8. July 2012 CME (35 minutes) 6/13/2013 Previous non-vertebral fracture Previous non-vertebral fracture Family history of hip fracture is a Family history of hip fracture is a predicts future fracture predicts future fracture strong risk factor for hip fracture strong risk factor for hip fracture • History of fracture: 1.5-3.0 fold • 2-fold increased risk of greater risk of fracture hip fracture True for • Regardless of hip BMD • “ “ “ “ My mother had a spine • any fracture type (ankle, finger) fracture ” ” or ” ” • even traumatic fractures “ osteoporosis ” “ “ “ ” ” : ” • especially strong for men • Mostly independent of BMD no increased risk. vanStaa, Osteop Int 2002;13:624-9 Meta-analysis: Klotzbuecher, JBMR 2000;15:721; Kanis Osteop Int 2004 Low BMI is a strong risk factor for Low BMI is a strong risk factor for Guess our risk of hip fracture Guess our risk of hip fracture fracture fracture Higher weight is protective. Lower weight is strong predictor of hip fracture and of low BMD De Laet et al. 2005 24July12 8

Download Presentation
Download Policy: The content available on the website is offered to you 'AS IS' for your personal information and use only. It cannot be commercialized, licensed, or distributed on other websites without prior consent from the author. To download a presentation, simply click this link. If you encounter any difficulties during the download process, it's possible that the publisher has removed the file from their server.

Recommend


More recommend