
SLIDE 1
Diatom/Dinoflagellate Index
N.Wasmund, J.Kownacka, J.Göbel, A.Jaanus, M.Johansen, I.Jurgensone, S.Lehtinen
1
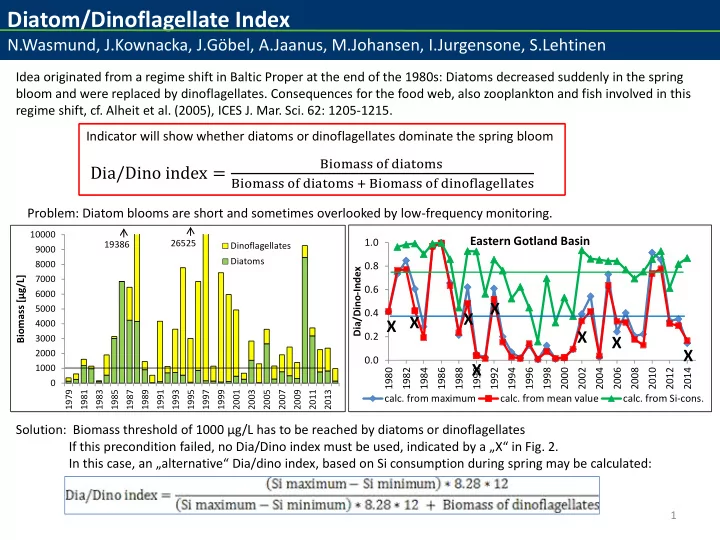
Idea originated from a regime shift in Baltic Proper at the end of the 1980s: Diatoms decreased suddenly in the spring bloom and were replaced by dinoflagellates. Consequences for the food web, also zooplankton and fish involved in this regime shift, cf. Alheit et al. (2005), ICES J. Mar. Sci. 62: 1205-1215. Indicator will show whether diatoms or dinoflagellates dominate the spring bloom
Dia/Dino index =
Biomass of diatoms Biomass of diatoms + Biomass of dinoflagellates
Problem: Diatom blooms are short and sometimes overlooked by low-frequency monitoring. Solution: Biomass threshold of 1000 µg/L has to be reached by diatoms or dinoflagellates If this precondition failed, no Dia/Dino index must be used, indicated by a „X“ in Fig. 2. In this case, an „alternative“ Dia/dino index, based on Si consumption during spring may be calculated:
1000 2000 3000 4000 5000 6000 7000 8000 9000 10000 1979 1981 1983 1985 1987 1989 1991 1993 1995 1997 1999 2001 2003 2005 2007 2009 2011 2013
Biomass [µg/L]
Dinoflagellates Diatoms 19386 26525
0.0 0.2 0.4 0.6 0.8 1.0 1980 1982 1984 1986 1988 1990 1992 1994 1996 1998 2000 2002 2004 2006 2008 2010 2012 2014 Dia/Dino-Index
Eastern Gotland Basin
- calc. from maximum
- calc. from mean value
- calc. from Si-cons.