diatom dinoflagellate index
play

Diatom/Dinoflagellate Index N. Wasmund, J. Gbel, A. Jaanus, M. - PowerPoint PPT Presentation

Diatom/Dinoflagellate Index N. Wasmund, J. Gbel, A. Jaanus, M. Johansen, I. Jurgensone, J. Kownacka, K. Piwosz Silicate consumption as proxy for diatom growth in spring Diatoms Smoother & confidence interval Smoother Upper limit Low er


  1. Diatom/Dinoflagellate Index N. Wasmund, J. Göbel, A. Jaanus, M. Johansen, I. Jurgensone, J. Kownacka, K. Piwosz Silicate consumption as proxy for diatom growth in spring Diatoms Smoother & confidence interval Smoother Upper limit Low er limit In spring, Gotland Sea (a) Si conc. before the bloom 25 Mecklenburg Bight Si consumption by the bloom 20 Si [mmol/m³] 3 15 10 5 2 0 79 80 81 82 83 84 87 88 89 90 92 93 94 95 96 97 98 99 Year 1 (c) 30 Bornholm Sea 1981 1983 1985 1987 1989 1991 1993 1995 1997 1999 25 Si [mmol/m³] 20 Dinoflagellates Smoother & confidence interval 15 Smoother Upper limit Low er limit In spring, Gotland Sea 10 5 0 80 81 82 83 84 85 86 87 88 89 90 91 92 93 94 95 96 97 98 99 3 Year 
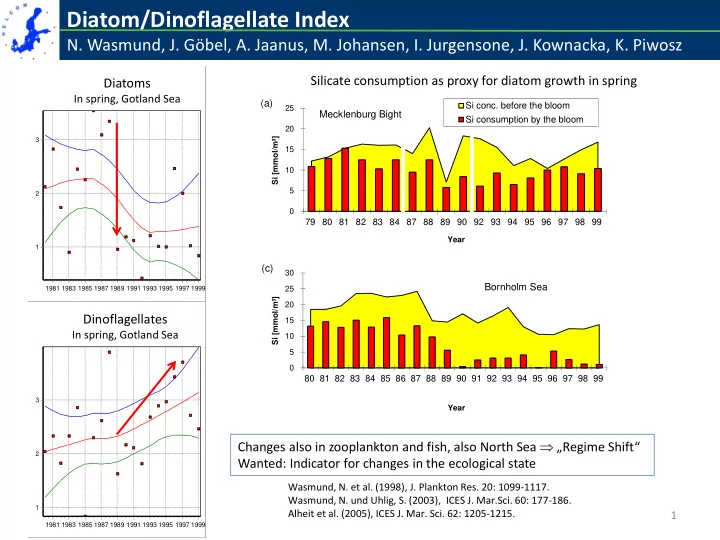
Changes also in zooplankton and fish, also North Sea  „Regime Shift “ 2 Wanted: Indicator for changes in the ecological state Wasmund, N. et al. (1998), J. Plankton Res. 20: 1099-1117. Wasmund, N. und Uhlig, S. (2003), ICES J. Mar.Sci. 60: 177-186. 1 Alheit et al. (2005), ICES J. Mar. Sci. 62: 1205-1215. 15.1.2015 1 1981 1983 1985 1987 1989 1991 1993 1995 1997 1999

  2. Diatom/Dinoflagellate Index N. Wasmund, J. Göbel, A. Jaanus, M. Johansen, I. Jurgensone, J. Kownacka, K. Piwosz Red Line = winter-minimum temperature 2 Wasmund et al. (2013): Journal of Plankton Research 35: 393-406; doi: 10.1093/plankt/fbs101

  3. Are changes in diatom and dinoflagellate spring blooms relevant for the ecosystem? Can they be used as indicators ? Approach: The indicator shows whether diatoms or dinoflagellates dominate in spring 𝐂𝐣𝐩𝐧𝐛𝐭𝐭 𝐩𝐠 𝐞𝐣𝐛𝐮𝐩𝐧𝐭 𝐄𝐣𝐛/𝐄𝐣𝐨𝐩 𝐣𝐨𝐞𝐟𝐲 = 𝐂𝐣𝐩𝐧𝐛𝐭𝐭 𝐩𝐠 𝐞𝐣𝐛𝐮𝐩𝐧𝐭 + 𝐂𝐣𝐩𝐧𝐛𝐭𝐭 𝐩𝐠 𝐞𝐣𝐨𝐩𝐠𝐦𝐛𝐡𝐟𝐦𝐦𝐛𝐮𝐟𝐭 If Dia /Dino index = 0 → only dinoflagellates If Dia /Dino index = 1 → only diatoms Advantage: • Diatoms and dinoflagellates are the dominating groups (Baltic and world-wide)  High biomass, therefore high relevance, high statistical confidence • Tax. Identification on group level easy, no errors However: Differentiation autotrophic/mixotrophic versus heterotrophic dino‘s difficult. We want only„autotrophe /mixotrophe “, but heterotrophs not bloom-forming. Importance: Food for zooplankton (and zoobenthos). Question: Which group is the better food?  Dia/Dino-Index is more a foodweb indicator (D5) than a biodiversity indicator (D1), It may also serve as eutrophication indicator (if change from N- to Si-limitation) 3

  4. Diatom/Dinoflagellate Index N. Wasmund, J. Göbel, A. Jaanus, M. Johansen, I. Jurgensone, J. Kownacka, K. Piwosz Practical problems and solutions: • Sampling: from the upper mixed layer (different strategies are accepted) • Unit of phyto biomasse optional (wet weigt or carbon), low influence as quotient is calculated. Problems with large diatoms due to their high ww/C-ratio, will be discussed below. Perhaps different GES borders for wet weight and carbon. • Seasonal mean or maximum for calculation ? Has surprisingly little influence (discussed below) • Differentiation autotrophic/mixotrophic versus heterotrophic Dino‘s difficult. Little influence as bloom are mostly autotrophic, e.g. Peridiniella catenata, Gymnodinium corollarium • Besides of dinoflagellates, Mesodinium rubrum , may be dominant in the Baltic Proper. We decided to neglect Mesodinium to keep the indicator simple . • Low sampling frequency. Especially diatom blooms can be overlooked. Solution: Check on the basis of Si-consumption data. Si in µM. Biomass of Dino‘s in carbon [µg/l]. If dinoflagellate biomass is given in wet weight, conversion to carbon units by factor 0.13 4

  5. Diatom/Dinoflagellate Index N. Wasmund, J. Göbel, A. Jaanus, M. Johansen, I. Jurgensone, J. Kownacka, K. Piwosz General problems still to be solved Main problem: What is the „ good state “ (GES) ? Are diatoms or dinoflagellates „ good “ ? Does the ecosystem tolerate strong changes ? Preliminary solution : The „ historical “ condition is „ good “, strong (and sudden ?) changes are bad. Further problem: No measures possible to mitigate adverse changes 5

  6. Diatom/Dinoflagellate Index N. Wasmund, J. Göbel, A. Jaanus, M. Johansen, I. Jurgensone, J. Kownacka, K. Piwosz Which areas to be separated? Coastal waters to be included? • Data from mean or max. similar, max. slightly higher • Index extends from 0 to 1, strong fluctuations • Expected decrease at end of 1980s visible • GES – border at 0,5 ? 6

  7. Diatom/Dinoflagellate Index N. Wasmund, J. Göbel, A. Jaanus, M. Johansen, I. Jurgensone, J. Kownacka, K. Piwosz 7

  8. Diatom/Dinoflagellate Index N. Wasmund, J. Göbel, A. Jaanus, M. Johansen, I. Jurgensone, J. Kownacka, K. Piwosz Addition of Polish data (1996-2013) without coastal data: • • Good agreement between calculation based Similar tendency of the phytoplankton data based on mean values and on maximum values. on wet weight and those based on carbon. • • Similar tendency of the phytoplankton data Good agreement since 2002 when probably and the data based on silicate consumption. diatom cells were smaller. 8

  9. Diatom/Dinoflagellate Index N. Wasmund, J. Göbel, A. Jaanus, M. Johansen, I. Jurgensone, J. Kownacka, K. Piwosz The Diatom/Dinoflagellate Index in spring (Feb-April) in historical and more recent years, according to Wasmund et al. (2008). Year Date of Date of dinoflagellate Dia-Dino index Original data diatom maximum source maximum 1905 12.4.1905 12.4.1905 0.99 Lohmann (1908) 1906 11.4.1906 11.4.1906 0.87 Lohmann (1908) 1912 3.4.1912 3.4.1912 0.97 Busch (1916-1920) 1913 7.3.1913 13.2.1913 0.95 Busch (1916-1920) 1950 19.3.1950 30.3.1950 0.94 Gillbricht (1951) 2001 13.3.2001 26.3.2001 0.97 Göbel 2002 18.3.2002 2.4.2002 0.92 Göbel 2003 17.2.2003 17.2.2003 0.91 Göbel Dia/Dino indices in Kiel Bight, separated into open sea water and coastal water, for 2006-2010. Year Open sea water Coastal water 2006 0.94 0.95 2007 0.97 0.99 2008 0.86 0.97 2009 0.87 1.00 2010 0.99 0.99 No need to separate open and coastal waters ? Where to define GES? At Dia/Dino index = 0.7 ? 9

  10. Diatom/Dinoflagellate Index N. Wasmund, J. Göbel, A. Jaanus, M. Johansen, I. Jurgensone, J. Kownacka, K. Piwosz Main problem: What is the „ good state “ (GES) ? Are diatoms or dinoflagellates „ good “ ? Does the ecosystem tolerate strong changes ? Preliminary solution : The „ historical “ condition is „ good “, strong (and sudden ?) changes are bad. Further problem: No measures possible to mitigate adverse changes Interpretation (example): If diatom bloom  „GES“ If no diatom bloom No diatoms grown, Diatoms grown but immediately grazed, → no Si consumption. → Si consumption. → alternative groups ( Dino‘s ) may grow → less nutrients for alternative phyto groups → problem for zoobenthos (and zooplankton ?) → good for zooplankton  very lowDia/Dino-Index, also after control → onla problem for zoobenthos ?  lowDia/Dino-Index, but correction after control by Si consumption data  „ bad state “ by Si consumption data  „ good state “ 15.1.2015 EuNäP-Sitzung 10

Download Presentation
Download Policy: The content available on the website is offered to you 'AS IS' for your personal information and use only. It cannot be commercialized, licensed, or distributed on other websites without prior consent from the author. To download a presentation, simply click this link. If you encounter any difficulties during the download process, it's possible that the publisher has removed the file from their server.

Recommend


More recommend