
SLIDE 1
DEVELOP | ACQUIRE | PARTNER
MAY 2017
DEVELOP | ACQUIRE | PARTNER MAY 2017 Safe Harbor This presentation - - PowerPoint PPT Presentation
DEVELOP | ACQUIRE | PARTNER MAY 2017 Safe Harbor This presentation contains certain statements that are the Companys and Managements hopes, intentions, beliefs, expectations, or projections of the future and might be considered
MAY 2017
1
This presentation contains certain statements that are the Company’s and Management’s hopes, intentions, beliefs, expectations, or projections of the future and might be considered forward-looking statements under Federal Securities laws. Prospective investors are cautioned that any such forward- looking statements are not guarantees of future performance and involve risks and uncertainties. The Company’s actual future results may differ significantly from the matters discussed in these forward- looking statements and we may not release revisions to these forward-looking statements to reflect changes after we’ve made the statements. Factors and risks that could cause actual results to differ materially from expectations are disclosed from time to time in greater detail in the Company’s filings with the SEC including, but not limited to, the Company’s report on Form 10-K, as well as Company press releases.
2
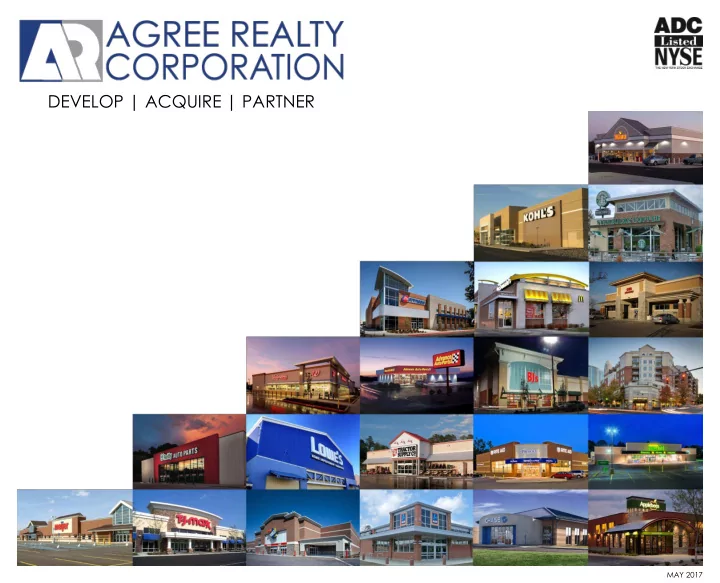
Our Company
▪ $1.7 billion retail net lease REIT headquartered in Bloomfield Hills, MI and listed on the NYSE under ticker ADC ▪ 377 retail properties totaling approximately 7.3 million square feet in 43 states ▪ 45% investment grade tenants and 10.6 years average remaining lease term
Our History
▪ 45 year operating history as a developer, owner and manager of retail properties ▪ IPO in 1994 to continue and expand business of predecessor company ▪ Formally launched acquisition platform in 2010 and Partner Capital Solutions (“PCS”) business in 2012
Our Business Plan
▪ Opportunistically expand and diversify our high-quality retail net lease portfolio through a refined and disciplined investment strategy ▪ Generate consistent and sustainable earnings growth ▪ Provide a reliable income stream through a growing dividend ▪ Maintain a conservative and flexible capital structure
Retail net lease REIT focused on growth through the acquisition and development of high-quality retail properties
As of March 31, 2017.
3
Announced the appointment of Merrie S. Frankel to the Company’s Board of Directors Raised $237 million in equity during 2016 through two follow-on offerings and the ATM program Expanded $350 million credit facility with an accordion up to $500 million Provided 2017 acquisition guidance of $200 million to $225 million, and 2017 disposition guidance
Declared a quarterly dividend of $0.495 per share, a 6.5% year-over-year increase Invested in 13 high-quality retail net lease assets for aggregate investment volume of $62 million in the first quarter of 2017
▪ Weighted-average acquisition capitalization rate of 7.6% ▪ Completed two development and Partner Capital Solutions projects
Increased Q1 2017 FFO per share by 6.3% to $0.65, and Q1 2017 AFFO per share by 5.9% to $0.65
Consistent execution has led to enhanced shareholder value
As of March 31, 2017.
5
Development
➢ “Organic” development ➢ 45 year track record ➢ Preferred developer status
Acquisitions
➢ Acquire stabilized assets ➢ Sale-leasebacks and third
party sellers
Partner Capital Solutions
➢ “Inorganic” development ➢ Partner with private developers ➢ Provide capital and development expertise
Site selection Entitlements Land purchase Construction Sale Land negotiation Delivery
Retail Net Lease Real Estate “Lifecycle”
Leverage real estate acumen and three investment platforms to identify best risk-adjusted retail net lease opportunities
ADC’s synergistic investment platforms adhere to the same core principles while pursuing opportunities along the full spectrum of net lease asset origination
▪ Bottoms-up underwriting => real estate and residuals matter ▪ 100% retail properties => superior real estate + longer term leases ▪ National and super-regional retailers => superior real estate + credit enhancement ▪ Emphasis on tenant real estate solutions => long-term relationships and repeat business
6
Emphasis on comprehensive real estate solutions drive multi-faceted partnerships
✓ Spearheading retailer expansion programs for over four decades
✓ Track record of execution as acquirer and real estate partner
competencies
DEVELOPMENT SALE-LEASEBACK
7
Investment Activity
$38.6 $81.5 $73.3 $147.5 $220.1 $295.8 $28.4 $17.7 $14.9 $38.0
$0.0 $50.0 $100.0 $150.0 $200.0 $250.0 $300.0 $350.0 2011 2012 2013 2014 2015 2016
Acquisitions Development / PCS
(1)
$ in millions
Since 2010, ADC has invested more than $1 billion in high-quality retail net lease properties
As of March 31, 2017. (1) Represents annual development and PCS activity, completed or commenced.
8
Established real estate capabilities and growing market presence driving increased investment opportunities
Annualized Base Rent (“ABR”) # of Properties
109 130 209 279 366 377
50 100 150 200 250 300 350 400 2012 2013 2014 2015 2016 Q1 2017
297 $38.1 $45.1 $56.5 $72.4 $94.3 $97.8
$30.0 $40.0 $50.0 $60.0 $70.0 $80.0 $90.0 $100.0 2012 2013 2014 2015 2016 Q1 2017
$ in millions As of March 31, 2017.
9
2013 2014 2015 2016 2017
Port St. John, FL
Our focus on real estate fundamentals guides non-core asset sales and capital recycling
Total Dispositions 2011-2017: $111.8MM
Petoskey, MI Petoskey Town Center Ironwood, MI Ironwood Commons Ypsilanti, MI Big Rapids, MI Ferris Commons Marshall, MI Marshall Plaza Chippewa Falls, WI Chippewa Commons East Lansing, MI Waynesboro, VA Lakeland, FL North Lakeland Plaza
$5.5MM $12.9MM $29.0MM $29.7MM
Rancho Cordova, CA Macomb Township, MI Ocala, FL
As of March 31, 2017.
$20MM - $50MM
Ann Arbor, MI
11
Top 3 Tenant Concentration (% ABR) Retail Sector Exposure Geographic Diversification
Execution has led to increased portfolio diversification and improved quality of rental income
70.0% 18.0% 10.0% 25.0% 40.0% 55.0% 70.0% 1/1/2010 Current 1/1/2010 (16 states) Current (43 states) +
✓
Pharmacy
✓
Bookstores
✓
General Merchandise
✓
Casual Dining
✓
Financial Services
✓
Auto Parts
✓
Pharmacy
✓
QSRs
✓
Health & Fitness
✓
Grocery Stores
✓
Warehouse Clubs
✓
Discount Apparel
✓
Convenience Stores
✓
Casual Dining
✓
Specialty Retail
✓
Home Improvement
✓
Theater
✓
Auto Parts
✓
Financial Services
✓
Healthcare
✓
Auto Service
✓
Entertainment Retail
✓
Crafts & Novelties
✓
Dollar Stores
✓
Pet Supplies
✓
General Merchandise
✓
Discount Stores
✓
Sporting Goods
✓
Home Furnishings
✓
Office Supplies
✓
Consumer Electronics
✓
Farm & Rural Supply 1/1/2010 Current
(Walgreens, Borders, Kmart) (Walgreens, Walmart, Lowe’s)
98%
7%
Retail Net Lease
2% Shopping Centers
71% 29%
1/1/2010 (73 properties) Current (377 properties) Shopping Centers Retail Net Lease
Property Type (% ABR)
6% Tenant Ground Leases Tenant Ground Leases As of March 31, 2017.
12
January 2015 March 2017
21.9% 4.4% 4.4% 377 properties 209 properties $0.8 billion $1.7 billion 10.5% 4.3% 3.2% Pharmacy 29.7% QSRs 7.5% Apparel 6.1% Top Tenants Top Sectors Enterprise Value # of Properties Pharmacy 15.0% QSRs 6.8% Grocery 6.8%
As of March 31, 2017.
13
$ in millions
Annualized Base Rent(1) Tenant / Concept % of Total
$10.3 10.5% 4.2 4.3% 3.1 3.2% 2.8 2.8% 2.7 2.7% 2.6 2.6% 2.5 2.6% 2.5 2.5% 2.4 2.5% 2.2 2.2% 2.2 2.2% 2.0 2.0% 1.9 1.9% 1.9 1.9% 1.8 1.9% 1.8 1.8% 1.7 1.7% 1.6 1.6% 1.5 1.6% 1.5 1.6% 1.5 1.5%
Other
43.3 44.4% Total $97.8 100.0%
Lease Expirations Retail Sectors Tenants
As of March 31, 2017. (1) Based on GAAP annualized base rent. 0% 2% 5% 3% 6% 4% 6% 9% 7% 5% 54%
0% 10% 20% 30% 40% 50% 60% 2017 2018 2019 2020 2021 2022 2023 2024 2025 2026 2027+
$ in millions
Annualized Tenant Sector Base Rent(1) % of Total Pharmacy $14.6 15.0% Restaurants – Quick Service 6.6 6.8% Grocery Stores 6.6 6.8% Discount Apparel 5.5 5.6% Auto Service 5.5 5.6% Health & Fitness 4.9 5.0% Specialty Retail 4.7 4.8% General Merchandise 4.0 4.0% Home Improvement 3.8 3.9% Warehouse Clubs 3.7 3.8% Crafts and Novelties 3.5 3.6% Farm and Rural Supply 3.4 3.4% Sporting Goods 3.1 3.2% Auto Parts 3.1 3.2% Dollar Stores 3.0 3.1% Convenience Stores 2.8 2.9% Restaurants – Casual Dining 2.5 2.5% Other 16.5 16.8% Total $97.8 100.0%
14
76%
15% 9%
National
Super-Regional Franchise
Industry-leading brands and retailers
Retail Tenant Type (% ABR)
As of March 31, 2017.
15
Retail Investment Grade Tenants Retail % of Total Portfolio
100% 100% 85% 80% 62% 54%
0.0% 25.0% 50.0% 75.0% 100.0% ADC NNN SRC O VEREIT STOR
ADC and peer data from first quarter 2017 supplemental or company SEC filings. (1) Excludes Office, Industrial and Distribution, as disclosed. (2) Excludes Manufacturing, Early Childhood Education Centers, Colleges and Professional Schools and All Other Service Industries, as disclosed.
Weighted-Average Lease Term Occupancy
Diversified portfolio of high-quality retail properties occupied by superior credit tenants under long-term leases
99.6% 99.5% 99.1% 98.4% 98.3% 97.7%
96.0% 97.0% 98.0% 99.0% 100.0% ADC STOR NNN VEREIT O SRC
45% 37% 31% 20%
10.0% 20.0% 30.0% 40.0% 50.0% ADC O VEREIT NNN SRC STOR
11.4 10.6 10.6 9.7 9.6
9.0 yrs 10.0 yrs 11.0 yrs 12.0 yrs 13.0 yrs STOR NNN ADC SRC O VEREIT 14.0
(2) (1) (1)
Undisclosed Undisclosed
16
▪ $9 million multi-tenant transaction acquired at a 9.1% year-one cap rate ▪ Located in one of the fastest growing suburbs in the Denver MSA ▪ Negotiated five-year early lease extension ▪ Five-mile population density of 130K
17
▪ Located in Silicon Valley ▪ Acquired as part of the $79.5 million portfolio transaction completed in June 2016 ▪ Demographics ▪ $128K median household income within a five- mile radius ▪ Five-mile population density of 474K
▪ Located in Southeast Florida ▪ Former site of regional shoe retailer currently being expanded and redeveloped ▪ Demographics ▪ $106K median household income within a five- mile radius ▪ Five-mile population density of 247K
18
▪ Credit upgrade in 2015 with Kroger’s acquisition of Harris Teeter ▪ Three-mile population density of 158K(1)
(1) Represents daytime population.
19
Chick-fil-A Frankfort, KY
Wawa Orlando, FL
Recently Completed
Starbucks North Lakeland, FL Texas Roadhouse Mount Pleasant, MI Burger King Heber, UT Camping World Georgetown, KY Orchard Supply Hardware Boynton Beach, FL
Under Construction
Camping World Tyler, TX
As of March 31, 2017.
21
Fixed Charge Coverage Ratio 4.0x Net Debt / Adjusted EBITDA 4.9x Total Debt to Total Market Capitalization 25%
Debt Maturities(1) Financial Ratios(1)
$0.0 $0.0 $25.0 $19.9 $7.8 $0.0 $0.0 $68.9 $100.0 $50.0 $7.8 $50.0 $60.0
$0.0 $20.0 $40.0 $60.0 $80.0 $100.0 2016 2017 2018 2019 2020 2021 2022 2023 2024 2025 2026 2027 2028
Revolving Credit Facility Mortgage/Unsecured Debt
$250.0
Common Equity
(2)
Equity Market Capitalization $1.3B Total Enterprise Value $1.7B
Capitalization Statistics(1)
(1) As of March 31, 2017. (2) Reflects the total commitments under the Company’s $250 million Revolving Facility. $ in millions
22
➢ Highest-quality retail real estate ➢ Most secure cash flows ➢ Strongest balance sheet ➢ Proven track record of execution ➢ Consistent dividend growth ➢ Robust growth trajectory