
SLIDE 1
DEVELOP | ACQUIRE | PARTNER
June 2020
DEVELOP | ACQUIRE | PARTNER June 2020 Agree Realty Corporation - - PowerPoint PPT Presentation
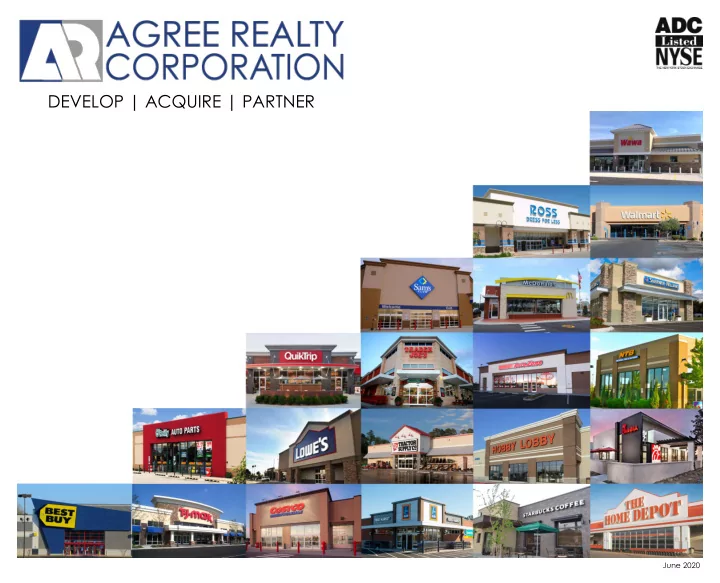
DEVELOP | ACQUIRE | PARTNER June 2020 Agree Realty Corporation Overview (NYSE: ADC) Net lease growth REIT focused on the acquisition and development of high-quality retail properties Our Company $4.3 billion (1) retail net lease REIT
DEVELOP | ACQUIRE | PARTNER
June 2020
1
Our Company
▪ $4.3 billion(1) retail net lease REIT headquartered in Bloomfield Hills, Michigan ▪ 868 retail properties totaling approximately 16.3 million square feet in 46 states ▪ 61.0% investment grade tenants(2) and 9.8 years average remaining lease term ▪ Investment grade credit ratings of Baa2 from Moody’s and BBB from S&P
Our Business Plan: Rethinking Retail Net Lease
▪ Capitalize on distinct market positioning in the retail net lease space ▪ Focus on 21st century industry-leading retailers through our three unique external growth platforms ▪ Leverage our real estate acumen and relationships to identify superior risk-adjusted opportunities ▪ Maintain a conservative and flexible capital structure that enables our growth trajectory ▪ Provide consistent, high-quality earnings growth and a well-covered, growing dividend
Net lease growth REIT focused on the acquisition and development of high-quality retail properties
Agree Realty Corporation Overview (NYSE: ADC)
As of March 31, 2020, unless otherwise noted. (1) As of June 24, 2020. (2) As of May 29, 2020.
[ kuh n-sis-tuh n-see ]
3
✓ Received April, May and June rent payments from 91%, 88% and 88%, respectively, of our portfolio(2) ✓ $147.4 million of second quarter-to-date acquisition activity including six Walmart stores ✓ $16.6 million of second quarter-to-date disposition activity including six franchise restaurants ✓ Re-leased former Art Van Flagship store; recovered 100% of prior rents with a 20-year net lease ✓ $778.2 million of gross equity proceeds raised via the ATM program and two follow-on offerings(3) ✓ 0.7x Proforma Net Debt / Recurring EBITDA as of the end of Q1 2020(3)(4) ✓ Received a BBB investment grade credit rating from S&P with a stable outlook ✓ Declared an increased quarterly dividend of $0.600 per share, a 5.3% year-over-year increase
Recent Highlights
As of May 29, 2020, unless otherwise noted. (1) Reflects full-year 2020 acquisition guidance provided by the Company on April 20, 2020. (2) As of June 22, 2020. (3) As of April 21, 2020. (4) Proforma for the settlement of the Company’s 2020 ATM forward equity offerings, March 2020 overnight offering and April 2020 forward offering.
Raised 2020 acquisition guidance to $700 million to $800 million(1)
4
$ in millions
Annualized Base Rent % of Total Tenant / Concept
$16.9 7.5% 10.0 4.6% 8.2 3.8% 7.4 3.4% 7.1 3.3% 6.8 3.2% 6.6 3.1% 6.4 3.0% 5.9 2.7% 5.5 2.6% 5.1 2.4% 4.9 2.3% 4.7 2.2% 4.7 2.2% 4.5 2.1% 4.0 1.9% 3.8 1.8% 3.7 1.7% 3.5 1.6% Other 96.3 44.6% Total $216.0 100.0%
Agree Realty at March 31, 2020
Tenants
$ in millions
Annualized Tenant Sector Base Rent % of Total Home Improvement $22.7 10.5% Tire and Auto Service 17.7 8.2% Grocery Stores 14.9 6.9% Off-Price Retail 13.5 6.3% Pharmacy 12.9 6.0% Convenience Stores 12.8 5.9% General Merchandise 12.6 5.8% Auto Parts 12.0 5.6% Dollar Stores 10.3 4.8% Consumer Electronics 8.8 4.1% Other 77.8 35.9% Total $216.0 100.0%
Company Overview
Share Price(1) $65.77 Equity Market Capitalization(1)(2) $3.6 Billion Property Count 868 properties Top 3 Tenant Concentration 14.7% Net Debt to EBITDA 4.8x / 0.7x(3) Investment Grade %(4)(5) 61.0% Team Members(1) 49 people
Retail Sectors
As of March 31, 2020, unless otherwise noted. (1) As of June 24, 2020. (2) Reflects shares and OP units outstanding multiplied by the closing price as of 6/24/2020. (3) As of April 21, 2020. Proforma for the settlement of the Company’s 2020 ATM forward equity offerings, March 2020 overnight offering and April 2020 forward offering. (4) Refer to footnote 1 on slide 5 for the Company’s definition of Investment Grade. (5) As of May 29, 2020.
(5) (5)
5
Strong Investment Grade Portfolio
National
Super-Regional Franchise
Best-in-class retailers with conservative balance sheets
Retail Credit Type (% ABR)
21% 61% 18% Investment Grade(1) Not Rated Sub-Investment Grade
z
As of May 29, 2020. Any differences are a result of rounding. (1) Based on ABR derived from tenants, or parent entities thereof, with an investment grade credit rating from S&P Global Ratings, Moody’s Investors Service, Fitch Ratings,
6
z
National and Super-Regional Retailers
National
Super-Regional Franchise
Industry-leaders operating in e-commerce resistant sectors
Retail Tenant Type (% ABR)
85%
12%
3%
National
Super-Regional
As of March 31, 2020. Any differences are a result of rounding.
7
Ground Lease Portfolio Breakdown
As of March 31, 2020. (1) Refer to footnote 1 on slide 5 for the Company’s definition of Investment Grade.
(1)
▪ 66 properties ▪ 8.5% of total ADC portfolio ABR ▪ 10.6 years weighted-average lease term
89%
Investment Grade(1) Sub-Investment Grade
Fee simple ownership + significant tenant investment
Ground Lease Portfolio Overview Credit Overview (% ABR) Top Ground Lease Tenants (% ABR) Leading Tenants
19% 16% 9% 9% 7%
WMT LOW Wawa HD Costco
1%
8
Leading, Pure-Play Retail Net Lease REIT
Investment Grade Tenants Retail % of Total Portfolio
ADC data as of March 31, 2020, unless otherwise noted. Peer data from first quarter 2020 supplementals, SEC filings, or earnings calls. (1) Excludes Office and Industrial, as disclosed. (2) Excludes Early Childhood Education, Career Education, Behavioral Health, Elementary and Secondary Schools, Lumber & Construction Materials Wholesalers, Wholesale Automobile Auction, Logistics, and All Other Service, as disclosed. (3) As of May 29, 2020.
Weighted-Average Lease Term Occupancy
Diversified portfolio of high-quality retail properties occupied by investment grade tenants under long-term leases
14.0
100% 100% 84% 81% 65% 59%
0.0% 20.0% 40.0% 60.0% 80.0% 100.0% ADC NNN O SRC VER STOR
99.5% 99.4% 99.3% 99.1% 98.8% 98.5%
96.0% 97.0% 98.0% 99.0% 100.0% STOR SRC ADC VER NNN O
61% 48% 37% 23% 18%
10.0% 20.0% 30.0% 40.0% 50.0% 60.0% ADC O VER SRC NNN STOR
11.1 10.0 9.8 9.2 8.3
8.0 yrs 9.0 yrs 10.0 yrs 11.0 yrs 12.0 yrs STOR NNN SRC ADC O VER
14.0
(1) (2) (3)
9
▪ The retail landscape continues to dynamically evolve as market forces cause disruption and change ▪ To mitigate risk in a period of continued disruption, the Company adheres to a number of investment criteria, with a focus on four core principles: ▪ E-commerce resistance (omni-channel critical) ▪ Focus on leading operators in e-commerce resistant sectors or those that have matured in omni-channel structure ▪ Recession resistance ▪ Emphasize a balanced portfolio with exposure to counter-cyclical sectors and retailers with strong credit profiles ▪ Focus on avoiding private equity sponsorship ▪ Strong emphasis on leading operators with strong balance sheets and avoidance of private equity sponsored retailers ▪ 10 out of 14 (or 71%) of the largest retailer bankruptcies since 2012 were at private equity-acquired chains(1) ▪ The private equity model of over-leveraged acquisitions eliminates a retailer’s ability to invest in the business ▪ Strong real estate fundamentals & fungible buildings ▪ Protects against unforeseen changes to our top-down investment philosophy
What Has ADC Been Investing In?
(1) Source: Pirate Equity; “How Wall Street Firms Are Pillaging American Retail” July 2019.
10 Sector % ABR(1) Since January 1, 2018 Notable Tenants E-Commerce Resistance Recession Resistance Private Equity Sponsorship Real Estate Attributes Comments Change in Exposure(2) Health & Fitness 3.5% 235 bps
High Yes High Weak
Private equity sponsorship, proliferation of low cost operators + single purpose boxes. Movie Theaters 1.8% 75 bps Low Moderate Limited Weak Single purpose boxes + online disruption = minimal exposure to leading
Franchise Restaurants(3) 1.6% 418 bps High Yes High Weak Private equity sponsorship + pricing =
dispositions of franchisees. Entertainment Retail 1.4% 28 bps High Moderate Accelerating Moderate Discretionary nature = limited exposure to leading operator with strong underlying real estate.
(1) As of March 31, 2020, unless otherwise noted. (2) Represents the change in the Company’s exposure, measured as the % of total ABR, from January 1, 2018 to March 31, 2020. (3) As of May 29, 2020.
Limited Exposure to At-Risk Sectors
11
Investment Activity
Ramping Investment Activity
$220.1 $295.8 $336.8 $607.0 $701.4 $14.9 $38.0 $62.7 $74.4 $32.4 $16.6
$0.0 $100.0 $200.0 $300.0 $400.0 $500.0 $600.0 $700.0 $800.0 2015 2016 2017 2018 2019 2020E
Acquisitions Development & PCS(3)
$700 to $800
(2)
$ in millions
ADC has invested more than $3.2 billion(1) in high-quality retail net lease properties since 2010
As of March 31, 2020, unless otherwise noted. (1) As of May 29, 2020. (2) Reflects full-year 2020 acquisition guidance provided by the Company on April 20, 2020. (3) Represents development and PCS activity, completed or commenced.
12
2016 2017 2018 2019 YTD 2020
Port St. John, FL
Active Portfolio Management
Focused on non-core asset sales & capital recycling
Total Dispositions 2010-2020: $338 million
(1)
$67.2M $29.7M
Rancho Cordova, CA Macomb Township, MI Ocala, FL
$45.8M
Michigan (3) North Dakota (3) Oscoda, MI Florida (2) Minnesota (3) Atlantic Beach, FL
$67.6M
(1)
Apopka, FL LA (1) & PA (1) MN (2) & ND (2) MT (1) & VA (1) Wichita Falls, TX Springfield, IL As of May 29, 2020. Graph is representative and does not include all dispositions. (1) Includes Meijer’s exercise of a purchase option totaling $3.9 million. Upland, CA Michigan (3) OH (2) & PA (2) MI (2), NY & FL Fort Worth, TX VA (3) Flowood, MS Maplewood, MN Tyler, TX Belton, MO
$41.6M
Midland, MI UT (2) & ND (1) Pensacola, FL Crosswinds Commons - Topeka, KS OH (3) & WV (1) Indianapolis, IN Arlington, TX
13
$28.4 $5.8 $40.0 $100.0 $50.0 $100.0 $50.0 $60.0 $100.0 $125.0 $125.0
$0.0 $20.0 $40.0 $60.0 $80.0 $100.0 $120.0 2020 2021 2022 2023 2024 2025 2026 2027 2028 2029 2030 2031
Revolving Credit Facility Unsecured Secured
$500.0(1)
Equity Market Capitalization(2) $3.6B Enterprise Value(2) $4.3B Total Debt to Enterprise Value 26.5% Fixed Charge Coverage Ratio 4.4x Net Debt / Recurring EBITDA(3) 4.8x / 0.7x(4) Credit Ratings Baa2 / BBB
Leading With Our “War Chest” Balance Sheet
Debt Maturities Credit Metrics Capitalization Statistics
$ in millions As of March 31, 2020, unless otherwise noted. (1) Reflects the total commitments under the Company’s $500 million Revolving Credit Facility; assuming two 6-month extension options are exercised. (2) As of June 24, 2020. (3) Reflects net debt to annualized Q1 2020 recurring EBITDA. (4) As of April 21, 2020. Proforma for the settlement of the Company’s 2020 ATM forward equity offerings, March 2020 overnight offering and April 2020 forward offering.
14
Investment Summary Highlights
➢ Fortified balance sheet ➢ Highest-quality retail real estate ➢ Investment grade credit ratings ➢ Multi-year track record of execution ➢ Well-covered & consistent dividend ➢ Robust growth trajectory
15
Forward-Looking Statements
This presentation contains forward-looking statements within the meaning of the federal securities laws, including statements about projected financial and
“expect,” “seek,” “anticipate,” “estimate,” “approximately,” “believe,” “could,” “project,” “predict,” “forecast,” “continue,” “assume,” “plan,” “outlook” or other similar words or expressions. Forward-looking statements are based on certain assumptions and can include future expectations, future plans and strategies, financial and operating projections or other forward-looking information. Although these forward-looking statements are based on good faith beliefs, reasonable assumptions and the Company’s best judgment reflecting current information, you should not rely on forward-looking statements since they involve known and unknown risks, uncertainties and other factors which are, in some cases, beyond the Company’s control and which could materially affect the Company’s results
potential adverse effect of the current pandemic of the novel coronavirus, or COVID-19, on the financial condition, results of operations, cash flows and performance of the Company and its tenants, the real estate market and the global economy and financial markets. The extent to which COVID-19 impacts the Company and its tenants will depend on future developments, which are highly uncertain and cannot be predicted with confidence, including the scope, severity and duration of the pandemic, the actions taken to contain the pandemic or mitigate its impact, and the direct and indirect economic effects of the pandemic and containment measures, among others. Moreover, investors are cautioned to interpret many of the risks identified in the risk factors discussed in the Company’s Annual Report on Form 10-K for the year ended December 31, 2019 and other filings with the Securities and Exchange Commission (the “SEC”), as well as the risks set forth below, as being heightened as a result of the ongoing and numerous adverse impacts of COVID-19. Additional important factors, among others, that may cause the Company’s actual results to vary include the general deterioration in national economic conditions, weakening of real estate markets, decreases in the availability of credit, increases in interest rates, adverse changes in the retail industry, the Company’s continuing ability to qualify as a REIT and other factors discussed in the Company’s reports filed with the SEC. The forward-looking statements included in this presentation are made as of June 24,
events, changes in the Company’s expectations or assumptions or otherwise. For further information about the Company’s business and financial results, please refer to the “Management’s Discussion and Analysis of Financial Condition and Results of Operations” and “Risk Factors” sections of the Company’s SEC filings, including, but not limited to, its Annual Report on Form 10-K and Quarterly Reports on Form 10-Q, copies of which may be obtained at the Investor Relations section of the Company’s website at www.agreerealty.com. All information in this presentation is as of June 24, 2020. The Company undertakes no duty to update the statements in this presentation to conform the statements to actual results or changes in the Company’s expectations.
Non-GAAP Measures
This presentation includes certain non-GAAP financial measures such as Core Funds from Operations (“Core FFO”), Adjusted Funds from Operations (“AFFO”), and net debt to recurring EBITDA which is presented on an actual and proforma basis. Reconciliations of these non-GAAP financial measures to the most directly comparable GAAP measures can be found in the Company’s Annual Report on Form 10-K, Quarterly Reports on Form 10-Q, and Quarterly Earnings Press Releases, all of which are available at the Invest section of the Company’s website at www.agreerealty.com. In addition, this presentation includes the non-GAAP measure of Annualized Base Rent (“ABR”). ABR represents the annualized amount of contractual minimum rent required by tenant lease agreements, computed on a straight-line basis. ABR is not, and is not intended to be, a presentation in accordance with GAAP. The Company believes annualized contractual minimum rent is frequently useful to management, investors, and other interested parties in analyzing concentrations and leasing activity.
Forward-Looking Statements & Non-GAAP Measures
DEVELOP | ACQUIRE | PARTNER