SLIDE 1
Description of data presentation from cadRCS with movie.exe The data - - PDF document
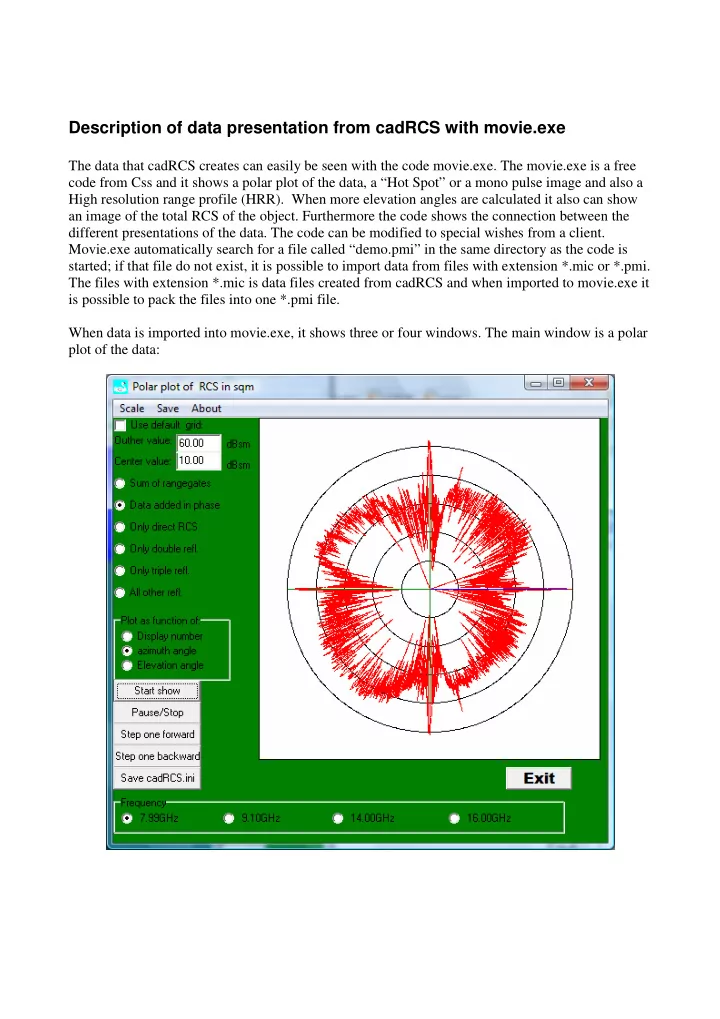
Description of data presentation from cadRCS with movie.exe The data that cadRCS creates can easily be seen with the code movie.exe. The movie.exe is a free code from Css and it shows a polar plot of the data, a Hot Spot or a mono pulse
SLIDE 2
SLIDE 3
Selecting radio button “Sum of rangegates” the polar plot then will show the RCS as RMS sum of range gates. This will also be close to a sliding mean of the RCS data all added in phase – this can be seen in the demo version “Kronsort2”, by shifting between the two buttons “Sum of rangegates” and “Data added in phase”. Selecting the button “Only direct RCS” the polar plot shows the data without any multiple
- reflections. “Only double refl.” gives a plot of all double reflections, “Only triple refl.” gives a plot
- f all triple reflections and “All other refl.” gives a plot of reflections that is more than three times.
The data can be displayed as a function of “Display number” (file number), “Azimuth angle” or “Elevation angle”. The show can be controlled by pushing the buttons “Start show”, “Pause/Stop”, “Step one forward”
- r “Step one backward”.
The file for initiating the calculation for cadRCS of the runs giving the polar can be saved by selecting the button “Save cadRCS.ini”. If more than one frequency was selected in the calculation with cadRCS then you can change the frequency at the button of the window – the window showing the “Hot Spot” images will be unaffected by this – only the main frequency images will be shown. If you have started the movie.exe with selecting *.mic files it is possible to pack these files into one file by selecting the button “Pack micro files”. In the window “Movie with HOT SPOTS” it is possible to set the interval time between images, pause/stop the show, save a bmp image of the hot spot image, zoom in and zoom out. On the window “High Resolution Range Profile” the colour scale is shown in the top of the image and it can be changed by changing the “Start scale in dB” and “End scale in dB”. The display can be zoomed in or out by changing “Pixels per point”. A range offset can be set and it is possible to see either a normal range profile or a height profile. It is possible to save a bmp image file of the range profile in the top of the window.
SLIDE 4
If a full analysis option was selected in cadRCS, then the movie.exe also shows a “Full analysis”
- window. For example from the demo Kronsort you get the window: