SLIDE 1 Department of Academic Preparation Curriculum Review Year 2011 − 2012
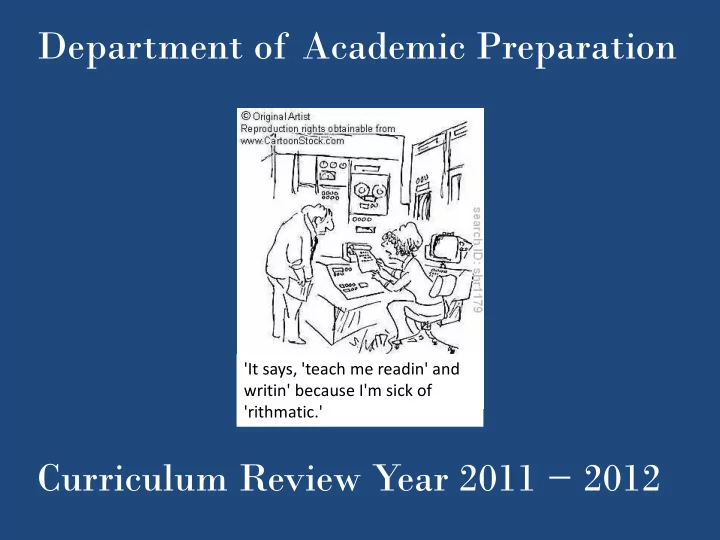
'It says, 'teach me readin' and writin' because I'm sick of 'rithmatic.'
SLIDE 2 “… if I don’t understand an assignment in a class, there’s the reading center, math center and writing center. The tutors don’t give you the answer; they encourage you to figure it
- ut as they push you in the right direction.
I’m very thankful for the centers because they have helped me a lot …”
Introduction
SLIDE 3 Help each student realize his/her full potential so that academic and career goals can be
- reached. Through our foundation courses and
- ur support centers, we assist students in
developing the abilities and confidence needed to achieve success in college level courses and in lifelong learning.
Mission
SLIDE 4
Policies and Procedures
… student success means readiness to move to and succeed at the next level of course work. Specifically, it means passing our classes by meeting exit grade requirements, and then passing the course at the next level, …
SLIDE 5 Policies and Procedures
- Proper placement
- Support of centers and staff
- Class and lab work integrated, except in math
- Common curriculum
- Department meetings devoted to sharing
ideas for helping students succeed
SLIDE 6 Demand, Completion, and Retention
80% of incoming students assess into at least
In the Fall 10 semester, over 3000 students (duplicated) enrolled in ESL and developmental.
- 475 in ESL (unduplicated)
- 1416 in developmental math
- 671 in developmental writing
- 592 in developmental reading
SLIDE 7
Demand, Completion, and Retention
Figure 1: Students enrollment in writing during fall semesters from 2007-2010
SLIDE 8 Demand, Completion, and Retention
- Fall course completion rates (by
discipline) from 2005 to 2010 range from 54% to 82%, with ESL course completion rates the highest.
- In a typical semester 2000 students
(duplicated) are successfully completing developmental courses and are ready to move to the next level developmental or gateway course.
SLIDE 9
Demand, Completion, and Retention
Figure 2: Developmental course completion rates from Fall 2008 to Fall 2011
SLIDE 10 Demand, Completion, and Retention
64% of the students who took Basic Writing had A-C in Comp I, compared to 59% of those who placed directly into the course.
- Institutional research data
SLIDE 11
Demand, Completion, and Retention
2007-2008 2008-2009 2009-2010 2010-2011 2012 Goal 48% 53% 64% 55% 60%
ATD data has tracked A-C completion rates in College Algebra and CA & Trig, for students from Basic Algebra II, as follows: A higher percentage of completers over the last few years compared with 2007-2008 baseline.
SLIDE 12 Demand, Completion, and Retention
A study by Dr. Jorge Santiago on Latino students found that the 4 major reasons for leaving NECC before completing their studies were:
- Family reasons
- Work related reasons
- Lack of money
- Transfer to another college
SLIDE 13 Demand, Completion, and Retention
Table from Dr. Santiago’s Report Reason for Leaving NECC Reason Total Family Reasons 23 (16.0%) Work Related 28 (19.4%) Transferred To Another School 21 (14.6%) Lack of Money 25 (17.4%) Poor relationship With Faculty 1 (.7%)
10 (6.9%) Other 24 (33.6%) No Response 2 (1.4%) Total 144 (100%)
SLIDE 14
Demand, Completion, and Retention
ATD data suggests that male students, students under 25, and Latino students in general have somewhat lower course completion rates in developmental courses and in subsequent gateway courses.
SLIDE 15
Demand, Completion, and Retention
Currently, we are involved in experimentation with Supplemental Instruction, Learning Communities, and a proposed mentoring program for Latinos, as suggested by the college’s Staff and Faculty Inquiry Group.
SLIDE 16
Curriculum
Each of our disciplines offers a carefully articulated curriculum that follows a logical progression.
SLIDE 17
Developmental Reading: Basic Reading College Reading
Curriculum
SLIDE 18
Developmental Writing: Intro to Basic Writing or
Curriculum
English Writing Skills (GEN 1.5 only) Basic Writing
SLIDE 19
Calculus Track Basic Math
Curriculum
Basic Algebra I Basic Algebra II Non-Calculus Track Basic Math Mathematical Literacy for College Students Developmental Math:
SLIDE 20
ESL:
Curriculum
Core (grammar) Levels I - IV Reading Listening /Speaking Writing Advanced Integrated Writing Skills (College level)
SLIDE 21
The curriculum coordinators, center coordinators, and full-time faculty in each discipline meet regularly to review and improve course curriculum.
Curriculum
SLIDE 22
Training is provided to new adjunct faculty, and experienced adjuncts are invited to participate in curriculum development.
Curriculum
SLIDE 23
Curriculum coordinators meet regularly with center coordinators to ensure alignment of class and lab activities.
Curriculum
SLIDE 24
Curriculum enhancement is also influenced by college data, student input, and national trends and standards.
Curriculum
SLIDE 25
Resources (faculty)
In the Fall ’10 semester, only 13% of our faculty were full-time, and they taught only 19% of our credit hours. Bad News: In 2011 we hired a new developmental math faculty. Good News: In 2012 we expect to hire new faculty in developmental math, writing, and ESL.
SLIDE 26 Resources (labs/centers)
Our centers play a vital role in our students’ success. For all disciplines except math, the centers are the loci of delivery for a significant part
- f the curriculum, and students are required
to use the centers to complete lab and/or class assignments.
SLIDE 27
Resources (labs/centers)
Studies (from the Math Center) show that students who use the center more are more successful in their classes.
SLIDE 28
Resources (labs/centers)
Surveys of students who use the centers indicate a high degree of satisfaction with them.
SLIDE 29
Program Outcomes (WRAT)
WRAT (Writing Reading Alignment Team) is a committee of faculty who teach along the continuum of writing and reading instruction with the intention of working on aligning our curricula and outcomes.
SLIDE 30
Program Outcomes (WRAT)
The focus of our work has been to share what we do at each level of writing and reading, and then to discuss the transitions and the common threads.
SLIDE 31
Program Outcomes (WRAT)
Our discussion has also focused on how we evaluate writing and use rubrics as a way to set standards and create consistency in evaluating student writing.
SLIDE 32
Program Outcomes (WRAT)
Reading has been identified as a key to preparing writing students for success in writing source-based essays.
SLIDE 33
Program Outcomes (Math Teams)
The Developmental Math Group (DMG) meets two hours each week to discuss issues involving curriculum and program development, instruction and pedagogy, student learning and the learning environment, and professionalism.
SLIDE 34
Program Outcomes (Math Teams)
During the spring 2011 and fall 2012 semesters the DMG developed a set of outcome statements for developmental math and the assessment instruments we will use.
SLIDE 35
Program Outcomes (Math Teams)
In 2009-2010 the DMG revised the cut-scores for the math placement test which resulted in better placement of students between our two algebra courses, Basic Algebra I and Basic Algebra II.
SLIDE 36
Program Outcomes (Math Teams)
The Achieving the Dream Math Strategy Team was formed as part of the Achieving the Dream initiative to improve mathematics retention at all levels.
SLIDE 37
Program Outcomes (Math Teams)
This committee, with faculty members from the college math department and developmental math area, has made steady progress in easing the transition from developmental math to college level math.
SLIDE 38 Strengths
- Success of our students
- A strong centralized department
- Integration of class and lab activities
- Professionally staffed centers
- Dedicated and high quality faculty
SLIDE 39 Strengths
- A highly coordinated, consistent and
well-developed curriculum
- Curriculum innovation
- Use of high impact practices
- Training for new adjunct faculty
- Internal and External Collaboration
SLIDE 40 Challenges
- Increase the percentage of students who
successfully complete our courses
- Increase the success rate of
underperforming sub-populations
- Increase efforts to shorten time in
developmental classes for certain students
SLIDE 41 Challenges
- We need more full-time faculty
- Collect data more systematically and
with greater intentionality
- More diagnostic information about
- ur students
SLIDE 42 Challenges
- Communications with college level
areas can be improved
- Across the Curriculum efforts can be
enhanced
- Better prepare students re the
college’s C.A.S.
SLIDE 43 Challenges
- Lawrence lab space is insufficient
- ESL Coordinator is only ¾ time
- Writing Center Coordinator is “
Acting”
- Math Center is overcrowded
SLIDE 44
Thank You!
Jim Sullivan, Gene Wintner and the entire curriculum review team. Our Reviewers: Jane Gagliardi, Sandra DeVellis, Liliana Brand Tammy Foster Ellen Wentland We will now entertain questions.