
SLIDE 1
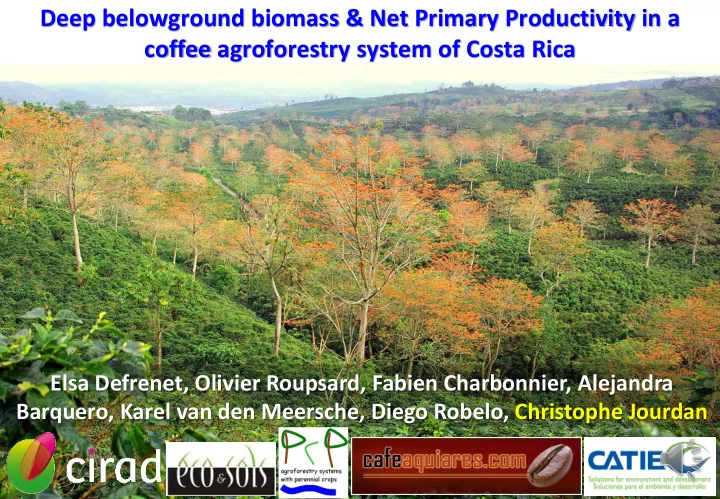
Deep belowground biomass & Net Primary Productivity in a coffee agroforestry system of Costa Rica
Elsa Defrenet, Olivier Roupsard, Fabien Charbonnier, Alejandra Barquero, Karel van den Meersche, Diego Robelo, Christophe Jourdan
Deep belowground biomass & Net Primary Productivity in a coffee - - PowerPoint PPT Presentation
Deep belowground biomass & Net Primary Productivity in a coffee agroforestry system of Costa Rica Elsa Defrenet, Olivier Roupsard, Fabien Charbonnier, Alejandra Barquero, Karel van den Meersche, Diego Robelo, Christophe Jourdan Context
Elsa Defrenet, Olivier Roupsard, Fabien Charbonnier, Alejandra Barquero, Karel van den Meersche, Diego Robelo, Christophe Jourdan
2
3
– Root perennial structures – Fine root production
– between coffee trees: planting rows vs inter-rows – between coffee and shade trees
4
Gvisible = visible growth; ∆R = Variation of Reserves; L = Mortality or litter production; Ex = Exportation; P = Pruning
5
6
7
Voronoi polygon
Stump
150 cm 0-10 cm 10-30 cm
Wall profile within the planting row Wall profile within the inter-row
¼ of Voronoi Voronoi polygon Row
Compensation
12 plants (6 full sun – 6 shade) Extrapolation to root front – 4 m deep
1.6m²
8
2 studied effects:
10 plants (5 full sun – 5 shade) Decision Matrix and Max-Min calculation methods
N
Voronoï polygon
Row Inter-row
Coffee plant
SEQUENTIAL CORING Sun coffee plants Shade plants Eddy flux Tower 50 m
1 2 9 1 6 1 2 9 1 60-30 cm soil sampling 0 – 4 m (extr.) Core Diam.: 8 cm
9 9
55% 30cm
Plant compartment compartment Biomass (t ha-1) Belowground Tap root 9.1 (50%) Coarse and mediuem roots 6.0 (33%) Total perennial roots 15.1 (83%) Fine roots 3.0 (17%) Total Belowground 18.1 (34%) Aboveground Perennial parts (stumps only) 21.2 Pruned branches and fruits 14,4 Total Aboveground 35,6 (66%)
Total root biomass amounts 34% of total plant biomass, likely a consequence of shoot prunning every 5 years No significant differences between sun and shade coffee root biomass
10
11
LAI =4.4 mleaf² msoil
LAI =2.2 mleaf² msoil
Method FR NPP Global plot T ha-1 y-1 FR NPP Row T ha-1 y-1 FR NPP Inter-row T ha-1 y-1 FR Turnover y-1 FR Lifespan y Decision Matrix Fairley & Alexander, 1985 1.64 2.14 1.14 0.72 1.39 Max-Min Nadelhoffer et al, 1985 1.38 1.93 0.96 0.85 1.18
12
13
Tap root: 0.8 t ha-1y-1 Stumps: 1.8 t ha-1y-1 Coarse roots: 0.2 t ha-1y-1 Medium roots: 0.3 t ha-1y-1
Fine roots: 2.2 t ha-1y-1
Total perennial roots: 1.3 t ha-1y-1
High potential for C sequestration in this agroforestry ecosystem
14
15