
SLIDE 1
6/9/2017 1
Population-Based Assessment of the Effect of MRI Background Parenchymal Enhancement on Future Primary Breast Cancer Risk
Vignesh Arasu, Diana Miglioretti, Brian Sprague, Nila Alsheik, Diana Buist, Louise Henderson, Sally Herschorn, Janie Lee, Tracy Onega, Garth Rauscher, Karen Wernli, Constance Lehman, Karla Kerlikowske June 9th, 2017 8th International Workshop on Breast Densitometry and Cancer Risk Assessment, San Francisco, CA
Declaration of Conflict
- f Interest
- None of the authors have any relevant conflict of interest
to declare
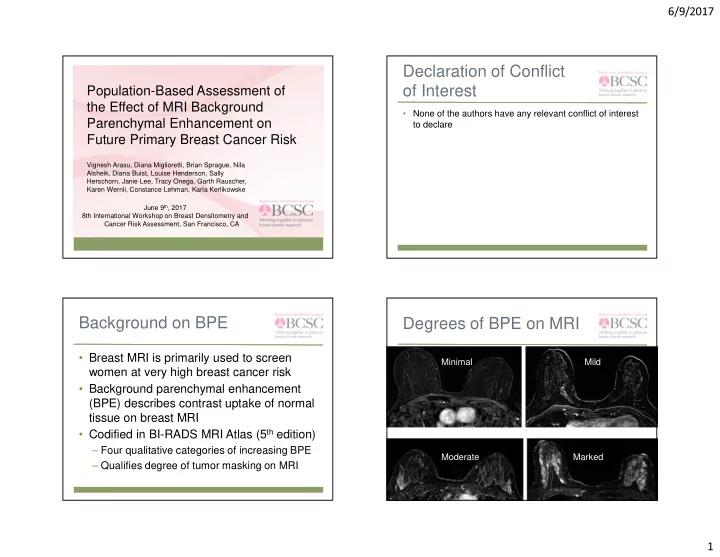
Background on BPE
- Breast MRI is primarily used to screen
women at very high breast cancer risk
- Background parenchymal enhancement
(BPE) describes contrast uptake of normal tissue on breast MRI
- Codified in BI-RADS MRI Atlas (5th edition)