
SLIDE 1
10/24/2014 1
PCOS across the Lifespan: An Update on Treatment Strategies
Marcelle I. Cedars, M.D. University of California – San Francisco
Conflict of Interest
- Financial conflict – none
- Research conflict
– Funded research:
- Ferring Pharmaceutical
- Nora Therapeutics
- Off –label drug use
– none
PCOS: Overview
Characterized by oligo-ovulation, hirsutism, polycystic ovaries 5-10% Reproductive age females Pathogenesis unclear:
- Androgen
- Insulin
- Pituitary
Familial clustering: genetic etiology ?
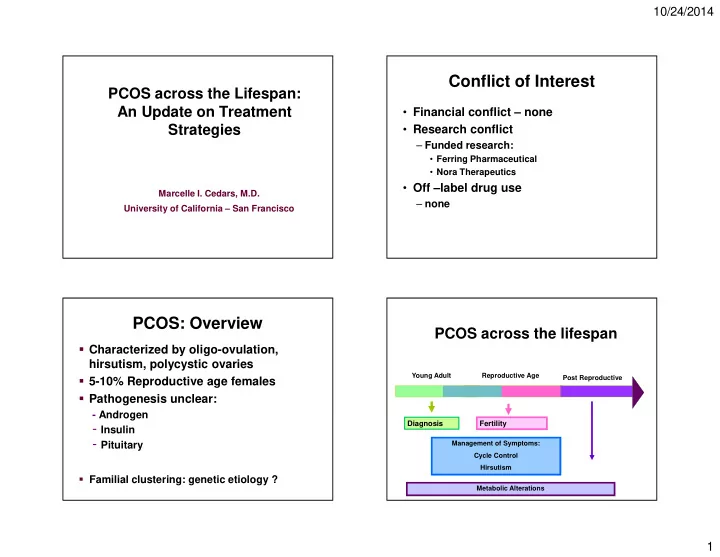
Young Adult Reproductive Age Post Reproductive
PCOS across the lifespan
Diagnosis Fertility
Management of Symptoms: Cycle Control Hirsutism Metabolic Alterations