
SLIDE 1
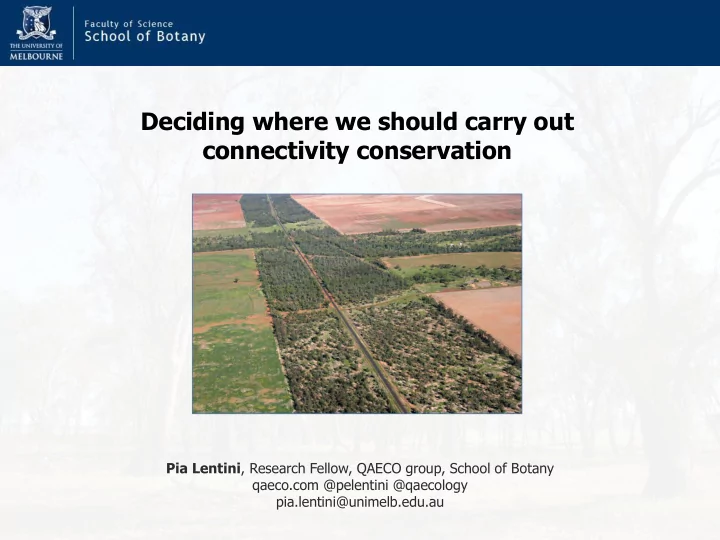
Deciding where we should carry out connectivity conservation
Pia Lentini, Research Fellow, QAECO group, School of Botany qaeco.com @pelentini @qaecology pia.lentini@unimelb.edu.au
Deciding where we should carry out connectivity conservation Pia - - PowerPoint PPT Presentation
Deciding where we should carry out connectivity conservation Pia Lentini , Research Fellow, QAECO group, School of Botany qaeco.com @pelentini @qaecology pia.lentini@unimelb.edu.au The Long Paddock disposal through sale may be an
Pia Lentini, Research Fellow, QAECO group, School of Botany qaeco.com @pelentini @qaecology pia.lentini@unimelb.edu.au
“The Long Paddock” “disposal through sale may be an appropriate
Support for rural communities
Other values for Australian society
Cultural heritage
Biodiversity conservation
spp
Canola crop Exotic pastures Cereal crop Native pastures Lucerne/clover pasture
specialists
Lentini, P. E., Fischer, J., Gibbons, P., Hanspach, J. and Martin, T. G. (2011) Value of large-scale linear networks for bird conservation: a case study from Travelling Stock Routes, Australia. Agriculture, Ecosystems and Environment, 141, 302-309.
Image: Dejan Stojanovic
Native ground cover
Stock route richness Condition index
Shrubs Peeling bark Logs Litter Hollows
Shrubs
Shrubs
important for woodland bird communities than stock route size
woodland birds, so incentives to maintain these areas should be considered
paddock trees
National Wildlife Corridors Plan.
1) Recolonisation Metapopulations persist because local extinctions are offset by recolonisation 100 30 10
2) Gene flow Between distinct populations prevents inbreeding depression AA bb CC aa BB cc f↑ f↑ Aa Bb cC aA BB Cc f↓ f↓
3) Climate change Species may need to shift their distributions as the climate warms 100 100 Altitude 100
Biophysical environment Species’ mobility Species’ habitat requirements
Text book principles
Cain et al (eds 2008) Ecology. Sinauer Associates.
How we decide where to put conservation reserves, or where to carry out certain conservation actions Principles of conservation planning:
community/ecosystem
species/communities/ecosystems across their distributions
adequately protected elsewhere already, protect something underrepresented instead
1 2 3 4 5 6 7 8 9
9 6 4 1 3 3
1 - $5 2 - $10 3 - $2 4 - $34 5 - $50 6 - $12 7 - $28 8 - $19 9 - $45
1 - $5 2 - $10 3 - $2 4 - $34 5 - $50 6 - $12 7 - $28 8 - $19 9 - $45 2 - $10
($500)
1 - $5 2 - $10 3 - $2 4 - $34 5 - $50 6 - $12 7 - $28 8 - $19 9 - $45 Want to minimise the edge (boundary) 100m 80m = 720m = 520m
1 - $5 2 - $10 3 - $2 4 - $34 5 - $50 6 - $12 7 - $28 8 - $19 9 - $45 IF connectivity is REALLY important 2 - $510 = 1080m ($83) = 720m ($565)
1 - $5 2 - $10 3 - $2 4 - $34 5 - $50 6 - $12 7 - $28 8 - $19 9 - $45 Landscapes aren’t neat squares!
1 - $5 2 - $10 3 - $2 4 - $34 5 - $50 6 - $12 7 - $28 8 - $19 9 - $45 1 - $5 1ha 2 - $10 1.75ha 3.25ha 4 - $34 0.75ha 5 - $50 1.5ha 3ha 7 - $28 1.75ha 2ha 5ha 6ha 4ha 10ha 10ha 7ha 3ha 6ha 4ha 10ha 10ha 7ha 3ha
Step 1: Build a habitat suitability model for each species
Probability of brown treecreeper = Temperature range + Precipitation of the driest month + Woody vegetation in 500m buffer + Vegetation condition in 500m buffer + Soil pH+ Vegetation “greeness” + Land use + Topographic wetness
Step 2: Decide how we think each species is going to respond to each action in each land use type
Action Grazing management Fencing Revegetation: Direct seeding Weeding Site type Pasture with vegetation Crop Modified Pasture Pasture with vegetation Crop Modified Pasture Pasture with vegetation Crop Modified Pasture Pasture with vegetation Crop Modified Pasture AON 1.207 0.604 3.021 1.52 3.021 1.52 1.482 1.49 1.488 BCH 1.378 7.853 20.65 19.648 7.853 20.65 19.648 1.454 1.477 1.476 BT 1.907 0.439 1.677 0.902 1.677 0.902 1.42 1.472 1.456 BRT 1.235 5.427 10.138 8.72 5.427 10.138 9.886 1.427 1.456 1.455 CB 3.854 2.916 1.387 4.581 6.648 6.527 1.428 1.454 1.447 CST 1.97 1.105 6.695 7.412 8.74 6.695 7.412 8.74 1.447 1.451 1.457 DF 1.709 1.83 13.607 19.719 16.226 13.607 26.57 29.89 1.465 1.478 1.479 EYR 1.97 1.105 6.032 11.204 5.541 6.032 15.097 10.207 1.433 1.468 1.456 FH 1.378 3.123 5.539 5.742 3.222 6.116 6.774 1.388 1.436 1.44 HR 1.207 34.58 59.433 43.816 34.58 86.924 79.061 1.481 1.487 1.487 JW 1.207 8.184 9.248 11.744 8.187 9.324 11.896 1.455 1.459 1.466 LL 1.907 1.094 1.37 1.691 1.094 1.37 1.691 1.462 1.468 1.472 PBQ 2.9 21.984 21.984 37.719 42.747 1.475 1.484 1.483 SK 1.907 6.449 1.579 2.09 6.554 3.272 5.588 1.478 1.471 1.476 SR 1.207 7.305 13.296 15.07 7.305 13.296 15.07 1.443 1.464 1.468 SW 1.235 4.94 2.1 1.083 4.94 12.025 8.648 1.421 1.47 1.45 SP 1.378 0.861 2.766 1.784 2.766 1.784 1.466 1.484 1.479 WBB 1.97 1.105 11.444 24.408 15.017 11.444 36.308 27.67 1.46 1.481 1.478 WBC 1.378 5.058 6.262 6.41 5.058 6.262 6.41 1.477 1.48 1.48 YTH 1.378 4.064 8.157 4.758 4.064 10.992 8.765 1.407 1.459 1.451
× 2 0.2 0.4 × 4 0.2 0.8 $321 $406 × 1.5 0.4 0.6 × 2 0.4 0.8 $321 $406
?
ROI = 0.2/321 = 0.00062 0.6/406 = 0.00148 0.6/406 = 0.00062 0.6/406 = 0.00098 0.0012 0.0025
Step 3: Decide on what the best action in each place is
Pretend you’ve already done the best action everywhere
Step 5: Model connectivity
Property owners: The Boland, East, Forde, Francis, Fuge, Gibb, Harper, Herbert, Kavanagh, Kelly, Kite, Knight, Knight, Markwort, Maslin, Matchett, McLachlan, Mitton, Naughton, Porritt, Robinson, Ryan, Sanderson, Smith, Sweeney, Sykes, Taylor, Thomas, Whyte, Worner, and Yerbury families, and the Darley global breeding
Field assistants: Corey Bunnell, Madelaine Castles, Lesley Hook, Lulu Lentini, Mary Long, Anna McConville, Alex Munro, Beth Noel, Gabbie Openshaw, Thomas O’Reilly, Mark Quinnell, Katherine Russell, Marcus Salton, Karen Stagoll, Jarom Stanaway, Caragh Threlfall Supervisors and collaborators: Joern Fischer, Brendan Wintle, Phil Gibbons, Tara Martin, Brad Law, Saul Cunningham, Jan Hanspach, David Lindenmayer, Michael Drielsma