
SLIDE 1
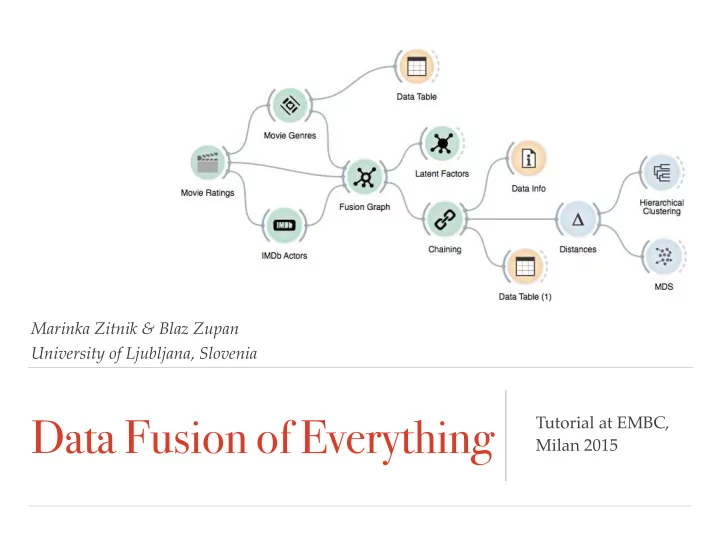
Marinka Zitnik & Blaz Zupan University of Ljubljana, Slovenia
Data Fusion of Everything
Tutorial at EMBC, Milan 2015
Data Fusion of Everything Tutorial at EMBC, Milan 2015 Tutorial - - PowerPoint PPT Presentation
Marinka Zitnik & Blaz Zupan University of Ljubljana, Slovenia Data Fusion of Everything Tutorial at EMBC, Milan 2015 Tutorial Overview Motivation: search for bacterial-response genes, a case study Warm up: recommender systems
Marinka Zitnik & Blaz Zupan University of Ljubljana, Slovenia
Tutorial at EMBC, Milan 2015
❖ Motivation: search for bacterial-response genes, a case study ❖ Warm up: recommender systems ❖ Data fusion: tri-factorization and sharing of latent features ❖ Examples: movies & genes ❖ Hands-on: visual programming and scripting ❖ Applications: case studies in prioritization and classification ❖ Other approaches: related work
EMBC Tutorial on Large-scale data fusion by collective matrix factorization
Search of bacterial response genes in a social amoeba Dictyostelium discoideum.
Gad Shaulsky Adam Kuspa Dictyostelium discoideum
Baylor College of Medicine, Houston, USA
Dicty is bacterial predator! genetic screen 50,000 clonal mutants genome found workload estimated 12,000 genes 7 genes 5 years ~200 genes
Gram+ defective: swp1, gpi, nagB1 Gram- defective: clkB, spc3, alyL, nip7
50% coverage (100 genes) 80% coverage (160 genes) 20 screens required! 65 screens required!
Genes
spc3 swp1 kif9 alyL nagB1 gpi shkA nip7
Mutant Phenotypes
Gram neg. defective Aberrant spore color Aberrant spore color Decreased chemotaxis Gram pos.defective
Genes Publications
spc3 swp1 kif9 alyL nagB1 gpi shkA nip7
MeSH terms Timepoints MeSH terms Mutant Phenotypes MeSH Ontology Phenotype data Phenotype Ontology Pubmed data Expression data MeSH annotations
Gram neg. defective Aberrant spore color Aberrant spore color Decreased chemotaxis Gram pos.defective
Genes Experiments
T1 T2 T3 T4 T5 T6 T7
Timepoints Normalized counts
V1 V2 V3 V4 V5 T1 T2 T3 T4 T5 T6 T7
gacT xacA racI racJ gemA racM racN rdiA gacT gemA rdiA racN racJ racI xacA racM gacT gemA rdiA racN racJ racI xacA racM
Genes Pathways Part of N-Glycan biosynthesis pathway Part of N-Glycan biosynthesis pathway
alg7 alg13 alg14 alg1 alg2 alg11 alg3 alg9 alg12 dpm1 dpm2 dpm3
Fructose and mannose metabolism GPI-anchor biosynthesis
Gene Ontology terms Gene Ontology terms
Response to bacterium Response to
Response to external biotic stimulus Response to external stimulus Response to biotic stimulus
Part of Gene Ontology graph
Defense response Defense response to
Response to stress Defense response to bacterium R e s p
s e t
h e r
g a n i s m s Defense response R e s p
s e t
t r e s s Response to bacterium
Medical Subject Headings Literature
MeSH terms
Cell separation Cytoplasmic vesicles/metabolism Ethidium/metabolism Immunity/innate Mutation Phagocytes/cytology Phagocytes/immunology* Phagocytosis*
Pathways Ontology terms
alg7 alg13 alg14 alg1 dpm1 dpm2 dpm3
Fructose and mannose metabolism
Protein N-linked glycosylation (GO:0006487) Dolichol kinase (K00902) Alpha-mannosidase II (K01231) Oligosaccharyltransferase complex (K12668) Orthology Ontology GO:0004168 GO:0004572 GO:0008250
Part of N-Glycan biosynthesis pathway
EMBC Tutorial on Large-scale data fusion by collective matrix factorization
Working with matrices: recommender systems, two- factorization and tri- factorization.
Genes
spc3 swp1 kif9 alyL nagB1 gpi shkA nip7
Mutant Phenotypes
Gram neg. defective Aberrant spore color Aberrant spore color Decreased chemotaxis Gram pos.defective
Kate Alex Jerry John Bride Wars Passengers War of the Worlds The Matrix Reloaded Mike Morgan Nick Jenny Pulp fiction The Godfather The Dark Knight Schindler’s List
Users Movies
Movie User
2 3 5 4 4 5 4 5
Kate Alex Mike John
B r i d e W a r s P a s s e n g e r s W a r
t h e W
l d s T h e M a t r i x R e l
d e d
0.2 0.5 0.5 0.5
Kate Alex Mike John
6.3 0 1.1 8 3.9 10.7 3.3
B r i d e W a r s P a s s e n g e r s W a r
t h e W
l d s T h e M a t r i x R e l
d e d L1 L2 L1 L2
2 3 5 4 4 5 4 5
Kate Alex Mike John B r i d e W a r s P a s s e n g e r s W a r
t h e W
l d s T h e M a t r i x R e l
d e d
0.2 1.6 2 5.4 1.7 3.2 0.6 4 2 5.4 1.7 1.3
0.2 0.3 0.8 0.2 0.7 1.2 0.8 1.2
Kate Alex Mike John
0.9 0.2 0.2 1 0.6 0.1 0.7 0.8
Bride Wars Passengers War of the Worlds The Matrix Reloaded
6.7 -5.8
U1 U2 M1 M2 U1 U2 M1 M2
2 3 5 4 4 5 4 5
Kate Alex Mike John Bride Wars Passengers War of the Worlds The Matrix Reloaded
0.3 0.2 1.2 1.7 4.5 0.2 2.1 4.1 0.5 0.9 4.5 1.5 4.8 0.1 1.9 1.1
EMBC Tutorial on Large-scale data fusion by collective matrix factorization
Collective matrix tri-factorization. Latent factor sharing.
B A
~ ~
x x =
A
Tri-factorization
B
Recipe matrix of A Recipe matrix of B Backbone matrix of A-B Reconstructed matrix A-B
~ ~
x x =
Collective tri-factorization
Recipe matrix of A Recipe matrix of B Backbone matrix of A-E Reconstructed matrix A-B
E B A E B A
Backbone matrix of A-B Recipe matrix of E
~ ~
x x =
Reconstructed matrix A-E
E B D C A F G
E B D C A F G
R = ⇤ R12 · · · R1r R21 ⇤ · · · R2r . . . . . . ... . . . Rr1 Rr2 · · · ⇤
S = 2 6 6 6 4 ⇤ Sk1×k2
12
· · · Sk1×kr
1r
Sk2×k1
21
⇤ · · · Sk2×kr
2r
. . . . . . ... . . . Skr×k1
r1
Skr×k2
r2
· · · ⇤ 3 7 7 7 5
2 { Θ(t) = Diag(Θ(t)
1 , Θ(t) 2 , . . . , Θ(t) r )
G = Diag(Gn1×k1
1
, Gn2×k2
2
, . . . , Gnr×kr
r
),
G≥0 J(G; S)
Rij∈R
j ||2 +
maxi ti
t=1
(8)
Input: A set R of relation matrices Rij; constraint matrices Θ(t) for t 2 {1, 2, . . . , maxi ti}; ranks k1, k2, . . . , kr (i, j 2 [r]). Output: Matrix factors S and G. 1) Initialize Gi for i = 1, 2, . . . , r. 2) Repeat until convergence:
S (GT G)−1GT RG(GT G)−1.
i
0 for i = 1, 2, . . . , r.
i
0 for i = 1, 2, . . . , r.
G(e)
i
+= (RijGjST
ij)+ + Gi(SijGT j GjST ij)−
G(d)
i
+= (RijGjST
ij)− + Gi(SijGT j GjST ij)+
G(e)
j
+= (RT
ijGiSij)+ + Gj(ST ijGT i GiSij)−
G(d)
j
+= (RT
ijGiSij)− + Gj(ST ijGT i GiSij)+ (10)
G(e)
i
+= [Θ(t)
i
]−Gi for i = 1, 2, . . . , r G(d)
i
+= [Θ(t)
i
]+Gi for i = 1, 2, . . . , r (11)
G G Diag( v u u t G(e)
1
G(d)
1
, v u u t G(e)
2
G(d)
2
, . . . , v u u t G(e)
r
G(d)
r
), (12) where denotes the Hadamard product. The p· and
· ·
are entry-wise operations.
EMBC Tutorial on Large-scale data fusion by collective matrix factorization
Data sampling. Completion scoring.
EMBC Tutorial on Large-scale data fusion by collective matrix factorization
A large data compendium. Functional genomics.
Gene
Gene annotation data
Literature Literature Topic Experiment Biochemical pathway Gene Ontology Term
Gene expression data Genetic and physical interactions G e n e l i t e r a t u r e Gene pathway data Literature on functions and processes Ontology structure Topics of yeast biology
Data at http://bit.ly/1Gb8SJ7
x x
= =
Chain of latent matrices
Gene Literature topic Gene profile matrix Gene Literature Literature Topic
Gene literature Topics of yeast biology
Gene Literature topic
EMBC Tutorial on Large-scale data fusion by collective matrix factorization
Dictyostelium bacterial gene hunt. Functional genomics. Drug-induced liver injury. Survival analysis.
4 seed genes 14 data sets, only one of which was directly related to bacterial response
R1,10 Θ1
ABC family
Miranda et al. 2013
Gene Gene Ontology term Phenotype Ontology term PubMed identifier MeSH descriptor Development
Parikh et al. 2010
Bacterial RNA-seq
Nasser et al. 2013
KEGG pathway Reactome pathway
1 4 8 2 3 5 6 7 9 10
R1,9 R1,8 R1,7 R1,6 R6,5 R6,4 R1,5 R1,4 R1,2 R2,3 R2,4 R5,4
Latent chains
Seed genes
Similarity estimation Gene ranking
Similarity score aggregation Seed genes Similarity scoring Candidate genes Candidate gene Chains i ix ii iv v vi vii viii iii Scored candidate gene Scored candidate genes Similarity score matrix Similarity scoring Similarity score matrices Similarity score aggregation
cf50-1 smlA acbA pirA rps10 abpC tirA DDB_G0272184 pikB vps46 pikA swp1 ggtA DDB_G0288519 pten DDB_G0288551 tra2 DDB_G0286429 dscA-1 cinC udpB sfbA modA DDB_G0287399 prmt5 sh DDB pt cf ac sm DDB DDB tr si rb DDB pi DDB DG1 ad DDB DD_ ds gdt pi DDB DDB ab
abpC– modA– cf50-1– tirA– Day 2 # of D. d cells AX4 acbA– smlA– pikA–/pikB– pten– 104 103 102 10 104 103 102 10 Day 3
Gene
PMID
R14
Experimental Condition
R13 1
GO Term
R 12
KEGG Pathway
R16 2
MeSH Descriptor
R45 R42 5 6 R62
1 2 3 4 5 6
Prediction task DFMF MKL RF F1 AUC F1 AUC F1 AUC 100 D. discoideum genes 0.799 0.801 0.781 0.788 0.761 0.785 1000 D. discoideum genes 0.826 0.823 0.787 0.798 0.767 0.788 Whole D. discoideum genome 0.831 0.849 0.800 0.821 0.782 0.801 Pharmacologic actions 0.663 0.834 0.639 0.811 0.643 0.819
Chemical
Θ1
Pharmacologic Action
R12
PMID
R13
Depositor
R14
Substructure Fingerprint
R15
Depositor Category
R46
1 2 3 4 5 6
Multi-classifier system Human in vitro Rat in vitro FSS Stacking with LR PCA RF, GBT, LR, SVM 0.741 0.765 CUR RF, GBT, LR, SVM 0.758 0.755
GO term
Θ13,13
Drug DILI potential Drug type
Θ10,10 R10;11
Sample metadata Sample from rat in vivo single dose study
R5;9 R5;12 R6;12
Sample from rat in vivo repeated dose study Sample from rat in vitro study
R7;9
Sample from human in vitro study
R8;9
Hematology, biochemistry, liver weight
R 10;14
Gene from rat in vivo single dose study
R1,5 R1,10 Θ1,1 R1,13 R5,10
Gene from rat in vivo repeated dose study
R2,6 R2,10 Θ2,2 R2,13 R6;9 R6,10
Gene from rat in vitro study
R3,7 R3,10 Θ3,3 R3,13 R7,10
Gene from human in vitro study
R4,8 R4,10 Θ4,4 R4,13 R8,10
1 2 3 4 5 6 7 8 9 10 11 12 13
14
Data fusion studies! AUC! In vivo studies! 0.819! In vitro studies! 0.790! Human in vitro study! 0.793! Animal in vitro study! 0.799! Animal studies! 0.811! Human studies! 0.792! All studies! 0.810!
R14 Copy number somatic mutation
Sample Gene miRNA Protein 1 5 2 3 4
R13 R15 R12
Gene Ontology term 6
Θ6 R56 R36 R46
Methylation
7
R17 R76
Survival data
I[n]
Time (months) Baseline cumulative hazard
3 6 9 12 15 18 21 24 0.4 0.2 0.0 0.6 0.8 1.0 1.2
Time (months) Cumulative hazard
3 6 9 12 15 18 21 24 0.0
0.2 0.4 0.6 0.8
Latent factor 1 Latent factor 2
A Data fusion schema Gene GO term DO term Drug
R13 R12 R14 Θ3 Θ2 Θ4
Θ(1)
1
Θ(2)
1
Θ(3)
1
Θ(4)
1
Θ(5)
1
crescentic glomerulonephritis acute proliferative glomerulonephritis glomerulonephritis nephritis interstitial nephritis kidney disease kidney failure urinary system disease
Example of an identified disease class
. . .
6
abetalipoproteinemia, lung metastasis dysgerminoma serous cystadenoma factor XIII defjciency Plasmodium falciparum malaria
Level 3
immune system diseases cognitive disorders acquired metabolic diseases metabolic diseases cancer
18
pulpitis periodontitis
Level 2
cancer inherited metabolic disorders nervous system diseases respiratory system diseases cardiovascular system disease
51
bile duct disease hemolytic-uremic syndrome
Level 1
Largest disease class
146
Hodgkin’s lymphoma Cushing’s syndrome gastric lymphoma crescentic glomerulonephritis
. . . . . .
Root layer
a single disease two diseases three or more diseases eighteen diseases
18
Disease class size:
EMBC Tutorial on Large-scale data fusion by collective matrix factorization
Network-based methods. Kernel-based methods. Probabilistic graphical models. Collective latent factor models.
D1 D2
1 2 3 4 5 6 7 8
Dint D1 D2
1 2 3 4 5 6 7 8
D1 D2
1 2 3 4 5 6 7 8
1 2 3 4 5 6 7 8 1 2 3 4 5 6 7 8Early integration Intermediate integration Late integration
Mostafavi et al., Genom Biol (2008); Mostafavi and Morris, Proteomics (2012).
Wang et al., Nat Methods 2014; Greene et al., Nat Genet 2015.
Original data
a b c d e
Patients Patients Patients Patients Patients Patient similarity matrices Patient similarity networks Fusion iterations Fused patient similarity network Patients mRNA expression DNA methylation Patient similarity: Patients mRNA-based DNA methylation–based Supported by all data
M2 M1
M K2 K1 µ1K1+ µ2K2=K w2 w1 w x x
f (x) f (x) f (x)
x
Lanckriet et al., Bioinformatics 2004; Yu et al., BMC Bioinformatics 2010; Gonen et al., JMLR 2012.
KL =
P
∑
m=1
ηmKm, K 0, tr(K) ≤ c
N
∑
i=1
αi − 1 2
N
∑
i=1 N
∑
j=1
αiα jyiyjk(xi,x j) with respect to α ∈ RN
+
subject to
N
∑
i=1
αiyi = 0 C ≥ αi ≥ 0 ∀i.
User-selected seed set entered via a web-accessible interface Gene expression dataset 1 Transcription factor binding sites Gene expression dataset 2 Gene expression dataset N Yeast two-hybrid dataset 1 Co-precipitation dataset 1 Gene expression Physical interactions Genetic interactions Synthetic lethality dataset Synthetic rescue dataset Sequence & text Localization Curated literature Data integration via a Bayesian network weights each evidence type probabilistically based on its accuracy and coverage
1 2 3 g w 4 h14 5 h15
3
(a) (b) (c) (d)
Pathway prediction via a probabilistic algorithm that considers direct and indirect connections of each gene to the seed gene set Results displayed in a dynamic visualization
Troyanskaya et al. PNAS 2003; Savage et al., Bioinformatics 2010; Badegeley et al. Bioinformatics 2015; Zitnik and Zupan, ISMB 2015.
Relation heterogeneity — borrow consistent patterns across many potentially heterogeneous input spaces. Object type heterogeneity — leverage heterogeneous types of features to improve the learning performance in each task. Task heterogeneity — exploit related prediction tasks to transfer knowledge between data views.
Effect relation Target relation
. . .
Target relation Effect relation
EMBC Tutorial on Large-scale data fusion by collective matrix factorization
http://github.com/marinkaz/scikit-fusion
EMBC Tutorial on Large-scale data fusion by collective matrix factorization
Current challenges. Towards universal data fusion.
1 2 3 4
Multislice Data
nodes resolution parameters coupling = 0
1 2 3 4 5 10 15 20 25 30nodes resolution parameters coupling = 0.1
1 2 3 4 5 10 15 20 25 30nodes resolution parameters coupling = 1
1 2 3 4 5 10 15 20 25 30Multiscale Data Multiplex & Multirelational Data
E B D C A F G Mucha et al. Science 2010.