
SLIDE 1
Meta Analysis in RevMan
Cre Creat ating ing a RevM a RevMan Pr an Profil
- file
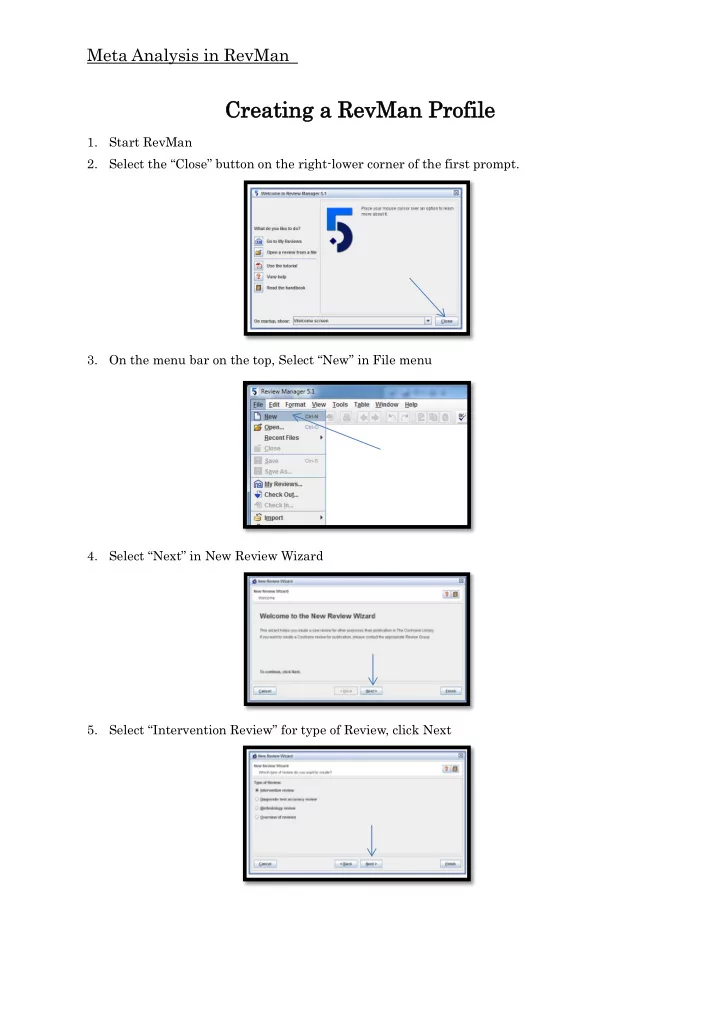
- 1. Start RevMan
- 2. Select the “Close” button on the right-lower corner of the first prompt.
- 3. On the menu bar on the top, Select “New” in File menu
- 4. Select “Next” in New Review Wizard
- 5. Select “Intervention Review” for type of Review, click Next