CONTROL OF LAMINATE QUALITY FOR PARTS MANUFACTURED USING THE RESIN - - PDF document

control of laminate quality for parts manufactured using
SMART_READER_LITE
LIVE PREVIEW

CONTROL OF LAMINATE QUALITY FOR PARTS MANUFACTURED USING THE RESIN - - PDF document

18 TH INTERNATIONAL CONFERENCE ON COMPOSITE MATERIALS CONTROL OF LAMINATE QUALITY FOR PARTS MANUFACTURED USING THE RESIN INFUSION PROCESS Q. Govignon, S.M.R. Kazmi, C.M.D. Hickey, S. Bickerton* Centre for Advanced Composite Materials, The


slide-1
SLIDE 1

18TH INTERNATIONAL CONFERENCE ON COMPOSITE MATERIALS

1 Introduction Resin infusion (aka. VARTM) is a member of the liquid composite moulding (LCM) family of processes, in which a dry fibrous preform is enclosed into a mould and impregnated with a reactive liquid resin. Resin Infusion, as compared to

  • ther LCM processes such as resin transfer

moulding, offers the advantage of requiring neither supplied positive pressure nor rigid matched mould. The tooling forces and mould costs can be kept to a minimum, but the processing time may be longer than for other LCM processes. It is therefore a very attractive process for the manufacture of medium to large sized parts in small to medium quantities. While being widely used in the marine and wind energy industries, the perceived lack of control of laminate quality and fibre volume fraction (Vf) has hindered the spread of this technique in the aerospace industry. This paper presents an experimental study into control of fibre volume fraction and laminate quality of panels manufactured using the resin infusion process. A study of the compaction behaviour of a selection of fibre reinforcements is presented, providing a guideline for estimating the potential for controlling the Vf of manufactured parts. Following this, an experimental study into the selection of process parameters on the quality of manufactured parts is presented. 2 Materials Three different non-crimp glass fibre reinforcement materials were used in this study. The three reinforcements were chosen to have a comparable areal weight but different architecture. Due to the differences in architecture, these reinforcements display different permeability and compaction

  • behaviour. The fabric referred to here as EQ is a

stitched quadriaxial glass reinforcement with

  • rientation of [90/45/0/-45], with an areal weight of

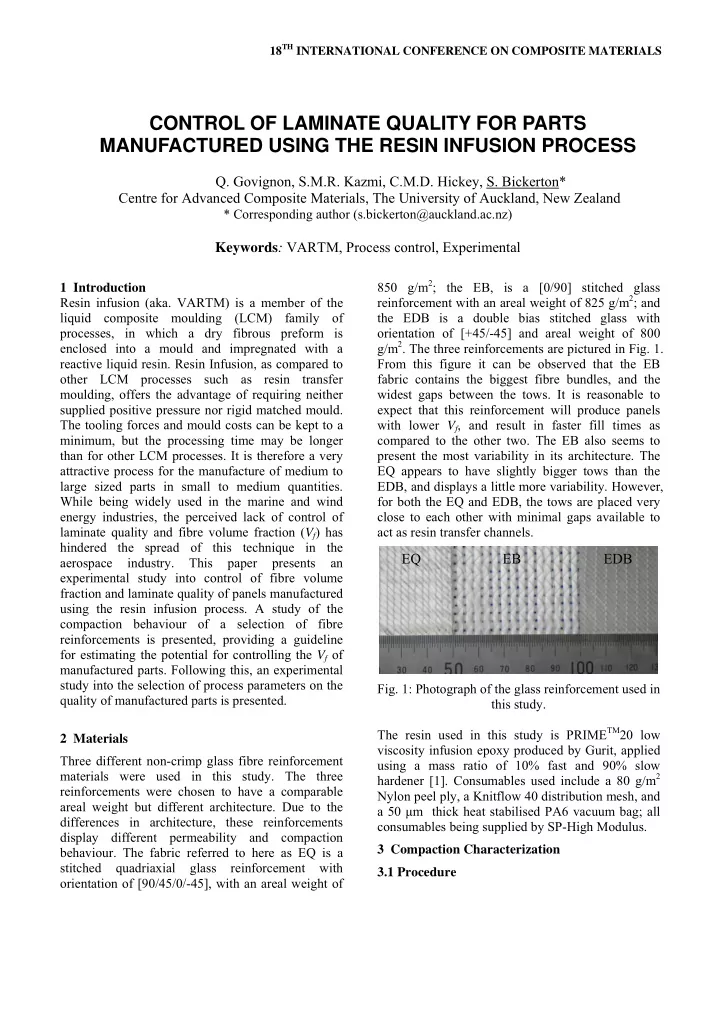
850 g/m2; the EB, is a [0/90] stitched glass reinforcement with an areal weight of 825 g/m2; and the EDB is a double bias stitched glass with

  • rientation of [+45/-45] and areal weight of 800

g/m2. The three reinforcements are pictured in Fig. 1. From this figure it can be observed that the EB fabric contains the biggest fibre bundles, and the widest gaps between the tows. It is reasonable to expect that this reinforcement will produce panels with lower Vf, and result in faster fill times as compared to the other two. The EB also seems to present the most variability in its architecture. The EQ appears to have slightly bigger tows than the EDB, and displays a little more variability. However, for both the EQ and EDB, the tows are placed very close to each other with minimal gaps available to act as resin transfer channels.

  • Fig. 1: Photograph of the glass reinforcement used in

this study. The resin used in this study is PRIMETM20 low viscosity infusion epoxy produced by Gurit, applied using a mass ratio of 10% fast and 90% slow hardener [1]. Consumables used include a 80 g/m2 Nylon peel ply, a Knitflow 40 distribution mesh, and a 50 μm thick heat stabilised PA6 vacuum bag; all consumables being supplied by SP-High Modulus. 3 Compaction Characterization 3.1 Procedure

CONTROL OF LAMINATE QUALITY FOR PARTS MANUFACTURED USING THE RESIN INFUSION PROCESS

  • Q. Govignon, S.M.R. Kazmi, C.M.D. Hickey, S. Bickerton*

Centre for Advanced Composite Materials, The University of Auckland, New Zealand

* Corresponding author (s.bickerton@auckland.ac.nz)

Keywords: VARTM, Process control, Experimental EQ EB EDB

slide-2
SLIDE 2

The procedure for studying the compaction behaviour of fibrous reinforcement during the resin infusion process is detailed in [2]. Specimens were cut and placed between two parallel plates mounted in an Instron universal testing machine. A compaction load was applied and ramped up to an equivalent compaction pressure of 1.0 bar on the dry

  • reinforcement. The preform was then saturated with

mineral oil, and the load was decreased down to an equivalent compaction pressure of 10 mbar, before being ramped up again to an equivalent pressure of 1.0 bar. This second compaction phase, which replicates the compaction occurring during the post filling stage, can serve as a basis to determine the range of fibre volume fraction achievable through control of the resin infusion process. 3.2 Results

a) b) c)

  • Fig. 2 : Traces of the secondary compaction for the

three reinforcements studied; a) EQ, b) EB, c) EDB.

  • Fig. 2 presents the compaction traces for the three
  • reinforcements. Four nominally identical samples

were prepared and tested under identical conditions. Some variability is observed in the compaction response, which can be attributed to variability in the reinforcement architecture, as well as variation in the inter-layer nesting of the reinforcement stack. The EB fabric appears to present the largest controllable Vf range out of the three fabrics, with a range from 0.44 to 0.486 if varying the compaction pressure between 0 and 1 bar. However, these values are significantly lower than those achieved with either EQ or EDB fabric. Both of these reinforcements have a very similar range of achievable Vf under resin infusion conditions, ranging from 0.49 to 0.53.

  • Fig. 3: Experimental setup for monitoring resin

infusion. 4 Resin Infusion Control 4.1 Experimental Setup The experimental setup presented in Fig. 3 is a development of the setup presented in [3]. The

200 400 600 800 1000 0.45 0.46 0.47 0.48 0.49 0.5 0.51 0.52 0.53 0.54 0.55

Compaction stress (mbar) Fibre volume fraction

EQ2 EQ3 EQ4 Panel measurements Average 200 400 600 800 1000 0.42 0.43 0.44 0.45 0.46 0.47 0.48 0.49 0.5 0.51 0.52

Compaction stress (mbar) Fibre volume fraction

EB1 EB2 EB3 EB4 Panel measurements Average 200 400 600 800 1000 0.47 0.48 0.49 0.5 0.51 0.52 0.53 0.54 0.55 0.56 0.57

Compaction stress (mbar) Fibre volume fraction

EDB1 EDB2 EDB3 EDB4 Panel measurements Average

Cameras for stereophtogrammetry and flow front tracking Temperature controlled enclosure Laminate Inlet pot Vent pot

slide-3
SLIDE 3

3 CONTROL OF LAMINATE QUALITY FOR PARTS MANUFACTURED USING THE RESIN INFUSION PROCESS

infusion experiments were performed in an enclosure permitting accurate control of ambient

  • temperature. The laminate thickness and flow front

progression were monitored using a pair of cameras mounted above the mould, and resin pressures were measured at three positions along the panel length using pressure transducers mounted below the

  • mould. The inlet and vent pots were equipped with

pressure regulators as well as pressure transducers.

  • Fig. 4: Schematic of the laminate and consumables

layout. The preforms were cut using a press and cutting template to a dimension of 230 x 450 mm. The materials lay-up and position of the pressure transducers is depicted in Fig. 4; the distribution media was cut 30 mm narrower than the glass reinforcement and was placed to stop 50 mm short

  • f the end of the preform towards the vent; a further

50 mm gap was left between the end of the reinforcement and the vent, with only peel ply to act as a break region. 4.2 Control Parameters The processing parameters considered for the control of laminate quality are the pressure applied at the inlet and vent during both filling and post- filling, and the action of clamping the inlet as

  • pposed to turning the inlet into a vent at the onset
  • f post-filling. Table 1 presents the plan of resin

infusion experiments, which has been designed to demonstrate the effect of varying the filling and post-filling conditions. All other parameters were kept constant throughout the study. Care was taken to use a consistent pre-filling procedure, with respect to cycling of the applied vacuum levels, and timing of the resin mixing and degassing. All panels were manufactured at a constant ambient temperature of 25°C, with the resin, hardener, and preform stabilized at that temperature beforehand. Table 1: Plan of experiments. Inlet / Vent condition during filling Inlet / Vent condition during post-filling Material (# of repeats) Atmospheric / full vacuum Full vacuum/ full vacuum EQ(3); EB(2); EDB(2) Atmospheric / full vacuum 500 mbar/ 500 mbar EQ(2); EB(1); EDB(1) Atmospheric / full vacuum 900 mbar / 900 mbar EQ(3); EB(1); EDB(2) Atmospheric / full vacuum Clamped / full vacuum EQ(1); EB(1); EDB(1) 650 mbar / full vacuum Full vacuum/ full vacuum EQ(1) 650 mbar / full vacuum 500 mbar/ 500 mbar EQ(1) 650 mbar / full vacuum 900 mbar / 900 mbar EQ(1) 4.3 Observations during Resin Infusion Table 2 presents the average fill time for each reinforcement, together with the standard deviation expressed in percent of the fill time. For the EQ reinforcement, the tests in which the inlet pressure was reduced to 650 mbar during filling are treated

  • separately. It appears that the EQ generates the

longest fill times, and also the most variability in fill

  • times. EB, despite being the reinforcement visually

presenting the most variability in architecture, appears to present very little variability in fill time. Table 2: Fill time and variations for each reinforcement.

Reinforcement (Inlet pressure) Mean fill time (s) Standard deviation (%) EQ (1000mbar) 645 20.1 EQ (650mbar) 1385 18.9 EB (1000mbar) 312 2.7 EDB (1000mbar) 480 8.7

Pos1 Pos2 Pos3 Pos4 Pos5 Pos6 Glass Distribution media Transducer/ hole Distribution tape

500 mm 1000 mm

5 mm 125 mm 125 mm 125 mm 125 mm 125 mm

Reinforcement

slide-4
SLIDE 4

a) b) c) d)

  • Fig. 5: Traces of the fluid pressure and laminate

thickness for four experiments; a) EQ A/0(r3), b) EQ A/C(r2), c) EQ 650/0, and d) EQ A/900(r3).

  • Fig. 5 presents the evolution of the fluid pressure

and laminate thickness at the positions highlighted in Fig. 4, for four selected infusion tests using the EQ fabric. During filling, it can be observed that the pressures quickly rise after the flow front passes

  • ver each transducer, but another rise of pressure

also occurs once the flow front arrives at the break. Due to the low porosity and permeability of the peel ply used as the break, most of the pressure gradient quickly moves into the break, resulting in increased resin pressures within the laminate and very small

  • gradient. It can be observed that by simply clamping

the inlet, resin pressures and laminate thickness decrease very slowly during post-filling. For experiment EQ A/C(r2) (see Fig. 5b) it takes approximately 1.4 hr for the pressures to stabilize, corresponding to the resin gel time. Even after this period of time the resin pressure inside the laminate had only dropped to 490 mbar while the vent pressure was set to full vacuum. The rate of pressure drop in the laminate is dependent on the ease of flow through the break, and folds in the vacuum bag

  • ver the break area can greatly affect this flow.

When the inlet is turned into a vent at the onset of post-filling (see Fig. 5a), pressures and thicknesses stabilize quickly within 15 min, resin pressures throughout the laminate very closely matching vent

  • pressure. This was expected, as turning the inlet into

a vent essentially halves the maximum distance between the vent and any point in the preform. Furthermore, on the vent side, the break acts to severely slow the flow of resin out of the preform. It can be observed that laminate thickness varies significantly in the inlet half of the preform during filling, when the inlet pot is maintained at atmospheric pressure. This is caused by increasing resin pressure decreasing local laminate compaction stress, as described by Terzaghi’s relation [4]. From laminate thickness traces it can be inferred that some excess resin is present close to the inlet during filling, reinforcing the benefits provided by turning the inlet into a vent during post-filling. This will quickly remove the excess resin from the closest

  • port. In comparison, for the experiment in which the

inlet was maintained at 650 mbar (see Fig. 5c), the laminate thickness stays almost constant throughout the filling stage. However, due to the decreased pressure gradient, the filling time was much longer. The resin appears in this experiment to have gelled very shortly after the onset of post-filling, the resin pressures dropping to about 400 mbar despite the inlet and vent being set to full vacuum. When raising the vent pressure at the onset of post- filling, it is important to ensure that the resin pressure inside the laminate is already at or above the desired post-filling pressure. If this is not the case, the sudden increase in laminate thickness and porosity has the potential to draw gas into the

Time (s) Fluid Pressure (mbar) Laminate thickness (mm)

1000 2000 3000 100 200 300 400 500 600 700 800 900 1000 4.6 4.8 5.0 5.2 5.4 5.6 5.8 6.0 6.2 6.4 Pressure at Inlet Pressure at Pos2 Pressure at Pos4 Pressure at Pos6 Pressure at Vent Thickness at Pos1 Thickness at Pos2 Thickness at Pos3 Thickness at Pos4 Thickness at Pos5 Thickness at Pos6

Time (s) Fluid Pressure (mbar) Laminate thickness (mm)

1000 2000 3000 100 200 300 400 500 600 700 800 900 1000 4.6 4.8 5.0 5.2 5.4 5.6 5.8 6.0 6.2 6.4

Time (s) Fluid Pressure (mbar) Laminate thickness (mm)

1000 2000 3000 100 200 300 400 500 600 700 800 900 1000 4.6 4.8 5.0 5.2 5.4 5.6 5.8 6.0 6.2 6.4

Time (s) Fluid Pressure (mbar) Laminate thickness (mm)

1000 2000 3000 100 200 300 400 500 600 700 800 900 1000 4.6 4.8 5.0 5.2 5.4 5.6 5.8 6.0 6.2 6.4

slide-5
SLIDE 5

5 CONTROL OF LAMINATE QUALITY FOR PARTS MANUFACTURED USING THE RESIN INFUSION PROCESS

laminate through the vent. The use of a break region serves to rapidly increase the fluid pressure inside the laminate at the end of filling. 5 Laminate Quality Assessment The quality of the manufactured panels has been assessed after postcure. Laminate Vf was calculated by measuring the laminate thickness at four locations along the length of the panels. The Vf was then associated with the final resin pressure in the laminate to be compared to the predictions made from the compaction experiments presented in Fig.

  • 2. While the compaction and Vf data do not match

exactly, the trend is recreated, and width of the Vf range is matched well. To assess the porosity and void content of the manufactured panels, the Vf calculated from the laminate thickness was compared to the Vf calculated from the fibre mass fraction. Mass fraction was measured by weighing the dry reinforcement before infusion, and comparing it to the mass of the panels. The difference, or error, between those two values can be used as an indication of the void content. This technique allows for a simple estimation of the void content, to quickly assess laminate quality. The error values presented in Table 3, have also been corroborated with visual inspection. Digital images were taken of the manufactured panels placed on a lightbox, recording the light transmitted through the panels. A laminate with minimal void content will let the majority of light through, while voids create further diffraction and reduce the amount of light

  • transmission. Fig. 6 presents four images taken from

manufactured panels; in each case the resin inlet is located at the left. It can be inferred from Table 3 that setting both inlet and vent to full vacuum during post-filling tends to result in higher void content, which correlates well with the visual inspection of manufactured panels. This can be due to two reasons; as the pressure decreases the resin can outgas during cure. In addition, if some voids are already present in the laminate, their size will increase as the local resin pressure decreases. The high void content is especially pronounced for the EB fabric, which has larger channels between tows, allowing for easier removal of resin under vacuum. As seen in Fig. 6a, the voids seem to be located mainly between the fibre tows. Table 3: Vf data measured from the laminate thickness and fibre mass fraction.

Code Final fluid pressure (mbar)

Vf

(Thickness)

Vf

(Mass) Error (%) EQ-A/0 (r1) 20 0.521 0.553 6.14 EQ-A/0 (r2) 100 0.513 0.547 6.63 EQ-A/0 (r3) 60 0.509 0.571 12.18 EQ-A/500 (r1) 480 0.505 0.529 4.75 EQ-A/500 (r2) 490 0.502 0.524 4.38 EQ-A/900 (r1) 910 0.469 0.495 5.54 EQ-A/900 (r2) 880 0.473 0.48 1.48 EQ-A/900 (r3) 870 0.470 0.499 6.17 EQ-A/C (r1) 710 0.497 0.515 3.62 EQ-A/C (r2) 490 0.511 0.541 5.87 EQ-650/0 390 0.508 0.539 6.63 EQ-650/500 480 0.510 0.526 3.14 EQ-650/900 850 0.466 0.499 7.08 EB-A/0 (r1) 80 0.456 0.552 21.05 EB-A/0 (r2) 60 0.461 0.557 20.82 EB-A/500 490 0.47 0.503 7.02 EB-A/900 790 0.427 0.464 8.67 EB-A/C 530 0.448 0.472 5.36 EDB-A/0 (r1) 80 0.54 0.577 6.85 EDB-A/0 (r2) 30 0.561 0.576 2.67 EDB-A/500 500 0.513 0.522 1.72 EDB-A/900 (r1) 920 0.514 0.542 5.45 EDB-A/900 (r2) 900 0.521 0.52 0.19 EDB-A/C 440 0.529 0.541 2.27

When the post-filling pressure is raised to 900 mbar, if the resin pressure inside the laminate near the vent is still low, it can be observed that the whole preform quickly relaxes. The decreased Vf requires an increased amount of resin if the void content is to

slide-6
SLIDE 6

stay minimal, it is therefore important to ensure that enough resin is present in the break and vent tube to equilibrate the increased laminate porosity. It was

  • bserved during the EQ-A/900 (r1) experiment, that

a significant amount of gas was drawn into the preform from the vent. This is evident in Fig 6c. For the second repeat of this test (EQ-A/900(r2), presented in Fig. 6d), the operator waited for the resin pressure to rise further once the flow reached the break. This resulted in minimal void formation in the part during post-filling. The introduction of voids through the vent was observed in all cases in which the pressure was raised at the onset of post-

  • filling. This occurred if the operator did not leave

enough time for the pressure inside the laminate to reach a level equivalent or higher than the newly set post-filling pressure, while the flow progressed through the break. a) b) c) d)

  • Fig. 6 Pictures of light transmitted through

manufactured panels; a) EB-A/0 (r2), b) EB-A/C, c) EQ-A/900 (r1), and d) EQ-A/900 (r2). Clamping the inlet at the onset of post-filling produces consistently good parts with respect to void content. However, the final resin pressure in the laminate can vary significantly depending on the ease of resin flow through the break. This can be affected by simple pleats in the bag, and will also depend upon the time left between the end of filling and the gelling of the resin. This practice therefore does not allow for good control of the final laminate

  • quality. This will lead to increased variability in the

mechanical properties of finished laminates, and also in part weight. 6 Conclusions It has been demonstrated in this paper that a certain level of Vf control can be achieved in the resin infusion process, by changing pressure levels applied at vents during the post-filling stage. Panels have been manufactured under a variety of conditions, using three fibre reinforcements. For each reinforcement material, good correlation has been made between measured compaction response, and achieved fibre volume fraction. The gains in productivity and control made possible by turning resin inlets into vents, were also

  • highlighted. While setting a very low post-filling

pressure appears to create a high void content due to resin boiling off, it was also demonstrated that care must be taken when raising the vent pressure at the

  • nset of post-filling as this can lead to voids

entering the preform through the vent. However, with careful operation, this technique can allow for greater control of the part quality, than is achievable using the classic approach of clamping the inlet and leaving full vacuum applied at the vent. References

[1] "PRIME™ 20LV - Epoxy Infusion System", http://www.gurit.com/prime-20lv.aspx [2] Govignon Q, Bickerton S, and Kelly PA. Simulation of the reinforcement compaction and resin flow during the complete resin infusion process, Composites Part A: Applied Science and Manufacturing 2010; 41(1). 45-57. [3] Govignon Q, Bickerton S, Morris J, and Kelly

  • PA. Full field monitoring of the resin flow and

laminate properties during the resin infusion process, Composites Part A: Applied Science and Manufacturing 2008; 39(9). 1412-1426. [4] Terzaghi K, Theoretical soil mechanics. New York: John Wiley and Sons, 1943.