contour plot and level curves
play

CONTOUR PLOT AND LEVEL CURVES 1 2 y 1 2 10 x 2 y 2 2 y 2 - PDF document

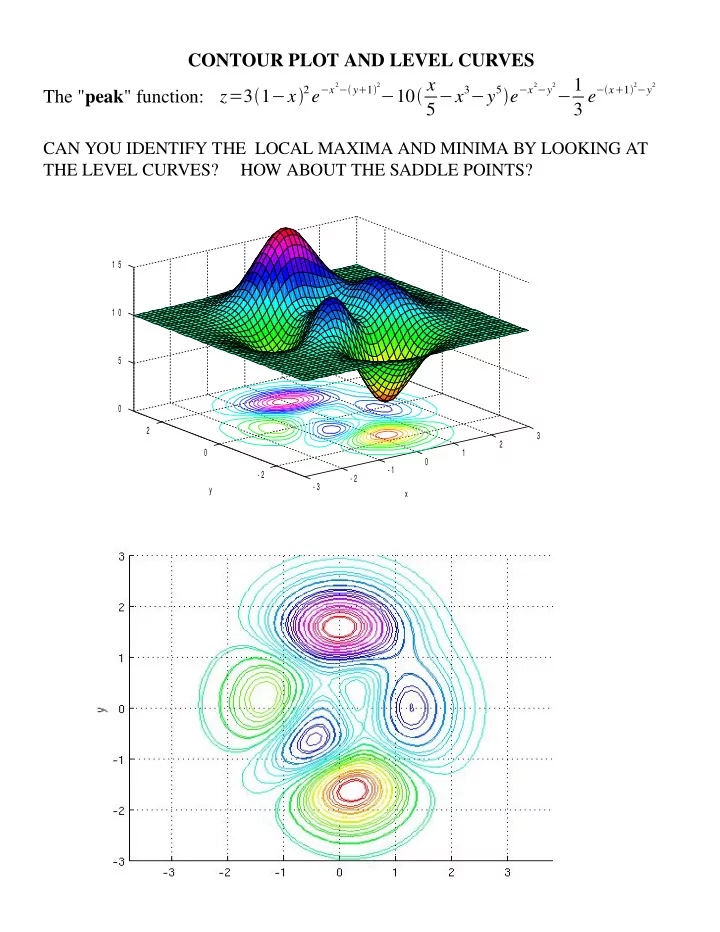
CONTOUR PLOT AND LEVEL CURVES 1 2 y 1 2 10 x 2 y 2 2 y 2 The " peak " function: z = 3 1 x 2 e x 5 x 3 y 5 e x 3 e x 1 CAN YOU IDENTIFY THE LOCAL MAXIMA


  1. CONTOUR PLOT AND LEVEL CURVES − 1 2 − y  1  2 − 10  x 2 − y 2 2 − y 2 The " peak " function: z = 3  1 − x  2 e − x 5 − x 3 − y 5  e − x 3 e − x  1  CAN YOU IDENTIFY THE LOCAL MAXIMA AND MINIMA BY LOOKING AT THE LEVEL CURVES? HOW ABOUT THE SADDLE POINTS? 1 5 1 0 5 0 2 3 2 0 1 0 - 1 - 2 - 2 - 3 y x

  2. Answer: x ≈ 1.28 , y ≈− 0.0048 Local Maximum x ≈ .228 , y ≈− 1.625 Local minimum x ≈− .460 , y ≈− .629 Local Maximum x ≈− 1.35 , y ≈ .204 Local minimum x ≈− 0.01 , y ≈ 1.58 Local Maximum x ≈ .296 , y ≈ .320 Local minimum x ≈− .266 , y ≈ .467 Saddle point x ≈ .416 , y ≈− .394 Saddle point x ≈ 1.10 , y ≈ .854 Saddle point Below, "m" stands for local minimum, "M" stands for local maximum and "S" stands for Saddle point.

Download Presentation
Download Policy: The content available on the website is offered to you 'AS IS' for your personal information and use only. It cannot be commercialized, licensed, or distributed on other websites without prior consent from the author. To download a presentation, simply click this link. If you encounter any difficulties during the download process, it's possible that the publisher has removed the file from their server.

Recommend


More recommend