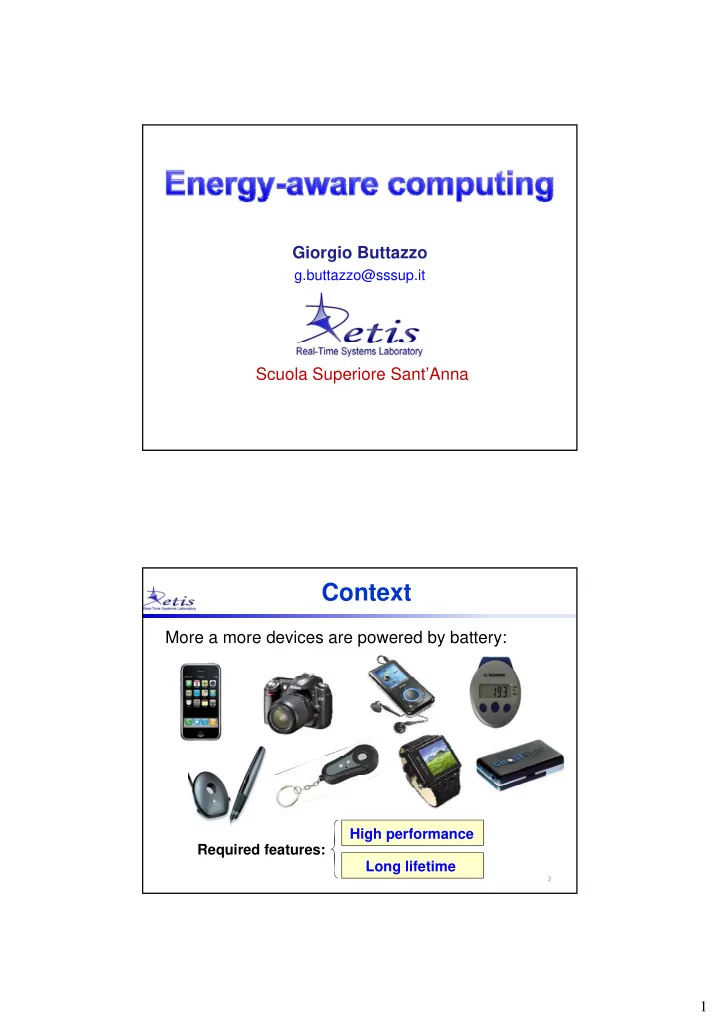
Context More a more devices are powered by battery: High - - PDF document

context
SMART_READER_LITE
LIVE PREVIEW

Context More a more devices are powered by battery: High - - PDF document

Giorgio Buttazzo g.buttazzo@sssup.it Scuola Superiore SantAnna Context More a more devices are powered by battery: High performance Required features: Long lifetime 2 1 Contrasting objectives The problem is not trivial, because


slide-1
SLIDE 1

1

Giorgio Buttazzo

g.buttazzo@sssup.it

Scuola Superiore Sant’Anna

Context

More a more devices are powered by battery:

2

Required features: High performance Long lifetime

slide-2
SLIDE 2

2

Contrasting objectives

The problem is not trivial, because performance and lifetime have opposite energy requirements:

High Performance High speed Long Lifetime Low energy High power Low power

power power

?

Progress of components

104 100 1000

4

year 1 10

1990 1994 1998 2010 2002 2006

slide-3
SLIDE 3

3

How to increase lifetime?

Considering the limited progress of batteries, the only hope to increase system lifetime is to reduce energy ti b t consumption by proper power management.

  • In real life, and also in embedded systems, a lot of

energy is wasted due to bad power management.

  • R

h k i d d t ti i

5

  • Research work is needed to optimize resource

usage and reduce waste.

Same problem in data centers

6

slide-4
SLIDE 4

4

Consumption in data centers

59% 8% 33%

7

Consumption in data centers

12000

Total Power W Server Power

10000 8000 6000

8

year

2000 2004 2008 2012 2016 4000

slide-5
SLIDE 5

5

How to reduce?

  • Outside air economizers
  • Expand temperature setpoints
  • Efficient cooling equipment

S

  • Efficient hardware
  • Optimized distribution
  • Efficient voltage regulators

Space Cooling Electrical Losses

9

Servers

  • Virtualization

12000

Servers Total Power

Consumption in data centers

Virtualization and Virtualization and Power efficiency impact

Servers

10000 8000 6000

10

year

2000 2004 2008 2012 2016

Virtualization impact

4000

slide-6
SLIDE 6

6

Power model

Power dissipation in CMOS integrated circuits is mainly due to two causes:

  • Dynamic power (P ) consumed during operation;
  • Dynamic power (Pd) consumed during operation;
  • Static power (Ps) consumed when the circuit is off.

Vdd

Inverter

Vdd

P-MOS

Vin V

  • ut

CL

Vin V

  • ut

Gnd

N-MOS

Vdd

P-MOS

Dynamic power

Dynamic power has two components:

  • 1. Switching power Psw

d d i l i t t

Isw Isc

Vin V

  • ut

CL

N-MOS

consumed during logic state change (1  0) to charge the load capacitance CL.

slide-7
SLIDE 7

7

Vdd

P-MOS

Dynamic power

Dynamic power has two components:

  • 1. Switching power Psw

d d i l i t t

Isc

Vin V

  • ut

CL

N-MOS

consumed during logic state change (1  0) to charge the load capacitance CL. Note that during transition (0  1) the capacitance is discharged through the N-MOS. discharged through the N MOS.

2 dd L sw

V f C P   

f = clock frequency The switching power can be expressed by: Vdd

Dynamic power

  • 2. Short circuit power Psc

consumed for a very short time, during the ramp time of the input signal when Vin V

  • ut

CL

Isc

the ramp time of the input signal, when input is at threshold voltage and both PMOS and NMOS are ON.

sc dd sc

I V P 

Hence, the total dynamic power is dominated by the switching power:

2 dd L sc sw d

V f C P P P     

slide-8
SLIDE 8

8

Static power

Static power Ps is due to a quantum phenomenon where mobile charge carriers Vdd g (electrons or holes) tunnel through an insulating region, creating a leakage current Ilk Vin V

  • ut

CL

Ilk

lk dd s

I V P 

  • Static power consumption is independent of the

switching activity is always present if the circuit is on.

  • As devices scale down in size, gate oxide thicknesses

decreases, resulting in larger leakage current.

CMOS Inverter

P-MOS N-MOS

Input

n-well p+ p+ n+ n+

Gate Source Source Drain Drain Gate

Vdd Gnd

Output p

p-substrate n well

slide-9
SLIDE 9

9

Dynamic vs. static power

Dynamic 102

Static Power significant at 90 nm

  • rmalized power

Static Power (leakage) Dynamic Power 1 10-2 1990 1995 2000 2005 2010 2015 2020

No year

Gate length (nm): 500 350 250 180 130 90 65 45 22 10-4 10-6

In summary

  • The dynamic power consumption increases with

the supply voltage and with the clock frequency:

  • Moreover, the supply voltage also affects the

circuit delay (hence the max clock frequency):

V

2 dd L d

V f C P   

2

) (

t dd dd

V V V D  

Vt = threshold voltage Note that D decreases for higher Vdd and lower Vt

slide-10
SLIDE 10

10

  • Hence, the dynamic power consumed by a system

can be controlled by scaling the clock frequency and the voltage at which the processor operates:

Dynamic Volt./Freq. scaling

and the voltage at which the processor operates:

dynamic Long lifetime low performance short lifetime high performance

Vdd

dynamic power

fmax

Dynamic Power Management

  • On the other hand, static power can be controlled

by turning the CPU off, or putting it in a sleep state:

The overhead to go sleep is the Break even time (B ):

Vdd

SLEEP1

The overhead to go sleep is the Break even time (Be): the deeper the sleep state, the longer the overhead.

Be(a,s) = as + sa active sleep1

OFF SLEEP2

t

active-to-sleep

  • verhead (as)

sleep-to-active

  • verhead (sa)

p sleep2 OFF

slide-11
SLIDE 11

11

Minimizing energy

In real-time systems, the problem is to minimize energy consumption still guaranteeing a desired level f f ( h d l f ibilit )

  • f performance (schedule feasibility).

power performance

V

fmax

Vmin

Low-power features

To exploit such a possibility, modern processors are designed to

  • work under different operating modes, each characterized

by a power consumption P, voltage V and clock frequency f: (P1, V1, f1), (P2, V2, f2), …, (Pm, Vm, fm)  Switching between two modes j-k is characterized by a power consumption Pjk and time overhead jk

  • have different low-power states, each characterized by a

specific power consumption and transition overheads:

S1(P1, 1as, 1sa), … SL(PL, Las, Lsa)

slide-12
SLIDE 12

12

Energy-saving methods

DVFS: Dynamic Voltage and Frequency Scaling The consumed energy is varied by acting on the

time

supply voltage and clock frequency:

time

Power

P(100 MHz) P(50 MHz)

time

P(sleep) reduced speed full speed

Energy-saving methods

DPM: Dynamic Power Management The consumed energy is varied by exploiting the

time

inactive low-power states of the processor:

time

Power

time

P(sleep) P(100 MHz) P(50 MHz) full speed sleep sleep full

slide-13
SLIDE 13

13

Energy-saving methods

Hybrid: DVFS + DPM The consumed energy is varied by exploiting

time

both techniques in different time intervals:

time

Power

time

P(sleep) P(100 MHz) P(50 MHz) full speed DPM DPM DVFS

Normalized speed

To make the analysis more general, instead of using the absolute clock frequencies, f1, f2, …, fm it is better to use a normalized speed s  [0,1]:

m

f f s 

s sm = 1 s3 f fm f1 f2 f3 s2 s1

slide-14
SLIDE 14

14

Notation

When dealing with processors with variable speed, often the schedule is represented in a bi-dimensional diagram, where time is on the x-axis and normalized speed is on the y-axis. For instance, the following schedule represents 3 jobs of a periodic task i with period Ti = 6 and WCET at the maximum speed Ci(1) = 1, executed at three decreasing speeds:

i

speed time

1 0.5

s = 1 s = 0.5 s = 0.25 2 8 14 20

Power model

To take different components into account, power consumption can be modeled as follows [Martin & Siewiorek, 2001]:

1 2 2 3 3

) ( K s K s K s K s P    

K3 expresses the weight of the power components that vary with both voltage and frequency. K2 captures the nonlinearity of DC-DC regulators in the range

  • f the output voltage
  • f the output voltage.

K1 is related to the hardware components that can only vary the clock frequency (but not the voltage). K0 represents the power consumed by the components that are not affected by the processor speed.

slide-15
SLIDE 15

15

WCET scaling

CCi = number of clock cycles required by i Ci = task computation time Ci

task computation time

s C s CC s C

i i i 1

) (  

Ci(s)

where

Ci(s1)

speed

i i i

CC s C C    ) 1 (

1

is the shortest execution time achievable at the maximum speed s1 s2 s3

Ci(s2) Ci(s3)

WCET scaling

In practice, several operations are performed on I/O devices and memory units that do not share the clock with the CPU.  For instance hard disk operations mostly depend on the  For instance, hard disk operations mostly depend on the bus clock frequency, the hard disk read/write speed, and the interference caused by other tasks accessing the bus. Hence, a more realistic model for the task WCET is:

s C C s C

i fix i i var

) (  

slide-16
SLIDE 16

16

WCET scaling

Note, however, that

C C s C

i fix i i var

) (  

it is more precise, but it

s C s C

i i

) (

complicates the analysis

s C s C

i i 1

) ( 

it is safe, because it represents an upper bound of the previous model In fact since

var 1

) 1 (

fix

C C C C   

In fact, since

) 1 (

i i i i

C C C C   

we have:

s C C s C s C

i fix i i fix i var var

  

for any s  1

Utilization scaling

Note that, if using the simplified model C(s) = C1/s:

U C s C

n n 1 1

) ( s U sT C T s C s U

i i i i i i 1 1

) ( ) (   

 

 

n i i i

T C U

1 1 1

where:

U(s) Um

 i i

T

1

is the task set utilization at smax = 1 s smin smax = 1

U1

slide-17
SLIDE 17

17

The energy saving problem

What is the best processor speed s that guarantees the application feasibility and i i i ti ?

For example, it is better to execute a task as fast as possible for a short time, or as slow as possible for long time?

minimizes energy consumption?

i

speed time

1 0.5

s = 1 s = 0.5 s = 0.25 2 8 14 20

The energy saving problem

In general, we always have that:

scaling up  shorter execution, higher power consumption g g scaling down  longer execution, lower power consumption

But we are interested in consuming less energy, not less power. When a processor is active at speed s for a time t,

  • the consumed power is P(s)
  • the consumed energy is E(s) = P(s)  t
slide-18
SLIDE 18

18

Energy per cycle

Since Ci is a function of the speed, the energy consumed for executing a task i at speed s is: ) ( ) ( ) ( s C s P s E

i i

  s CC s P s E

i i

) ( ) (  s CC s C

i i

 ) (

For example, if we consider we have: Therefore, what we actually need to minimize is the

s s P s Ec ) ( ) ( 

Energy per cycle:

s

Optimal speed

The speed that minimizes the energy per cycle is called optimal speed (or energy efficient speed) s*.

s s P s Ec ) ( ) ( 

1 2 2 3 3

) ( K s K s K s K s P     s K K s K s K s Ec

1 2 2 3

) (    

The value of the optimal speed depends on the specific architecture (i.e., the specific values of K0, K1, K2, K3).

slide-19
SLIDE 19

19

Examples

P1(s) = 0.9 s + 0.1 P3(s) = 0.5 s3 + 0.1

1.0

P2(s) = 0.5 s2 + 0.3 s P1(s)

0.5 0.6 0.7 0.8 0.9

Power P2(s)

0.1

P3(s)

0.1

Speed

0.2 0.3 0.4 0.5 0.6 0.7 0.8 0.9 1.0 0.2 0.3 0.4 2.0

Architecture 1

Ec1(s) = 0.9 + 0.1/s P1(s) = 0.9 s + 0.1

1.0 1.2 1.4 1.6 1.8

ergy per cycle Ec1(s) s1

*

Speed

0.1 0.2 0.3 0.4 0.5 0.6 0.7 0.8 0.9 1.0 0.2 0.4 0.6 0.8

Ene In this architecture, energy is minimized by running at the maximum speed.

slide-20
SLIDE 20

20

2.0

Ec2(s) = 0.5 s + 0.3 P2(s) = 0.5 s2 + 0.3 s

Architecture 2

1.0 1.2 1.4 1.6 1.8

ergy per cycle In this architecture, energy is minimized by running at the minimum speed. Speed

0.1 0.2 0.3 0.4 0.5 0.6 0.7 0.8 0.9 1.0 0.2 0.4 0.6 0.8

Ene Ec2(s) s2

*

2.0

Ec3(s) = 0.5 s2 + 0.1/s P3(s) = 0.5 s3 + 0.1

Architecture 3

1.0 1.2 1.4 1.6 1.8

ergy per cycle In this architecture, energy is minimized by running at an intermediate speed. Speed

0.1 0.2 0.3 0.4 0.5 0.6 0.7 0.8 0.9 1.0 0.2 0.4 0.6 0.8

Ene Ec3(s) s3

*

slide-21
SLIDE 21

21

2.0

Summary

Ec3(s) = 0.5 s2 + 0.1/s Ec1(s) = 0.9 + 0.1/s Ec2(s) = 0.5 s + 0.3

1.0 1.2 1.4 1.6 1.8

ergy per cycle Ec1(s) s1

*

Speed

0.1 0.2 0.3 0.4 0.5 0.6 0.7 0.8 0.9 1.0 0.2 0.4 0.6 0.8

Ene Ec3(s) s3

*

Ec2(s) s2

*

Observations

The energy-aware strategy depends on the specific architecture. p Further energy saving can be achieved by exploiting low-power states.

slide-22
SLIDE 22

22

Problem 1

What to do if the task set is not feasible at s*? Possible solutions

  • 1. Select a higher speed sH as the smallest speed sH > s*

Then apply DPM to exploit extra idle times.

  • 2. Compress

task utilizations (e.g., by applying elastic scheduling) so that the task set is feasible at s*

Problem 1

ergy per cycle Not feasible sH

Elastic compression Speed

Ene s*

0.2 0.4 0.6 0.8 1.0

slide-23
SLIDE 23

23

What to do if s* is not available on the platform? This only applies to type-3 architectures

Problem 2

Possible solutions

  • 1. Select a higher speed sH as the smallest speed sH > s*

Then apply DPM to exploit the extra idle times.

  • 2. Alternate execution between two adjacent speeds (sL, sH)

to approximate s*

Problem 2

ergy per cycle Not feasible sH sL

alternate Speed

Ene s3

*

0.2 0.4 0.6 0.8 1.0

slide-24
SLIDE 24

24

PWM-like execution

s Suppose that only two speeds are available (sL = 0.25, sH = 1), but the optimal speed minimizing energy is s* = 0.5. t s

1 0.75 0.50 0.25

L H L L H H eq

Q Q Q s Q s s   

QH QL

PWM-like execution

s Given (sL, sH), how to find (QL, QH) that produce seq? t s

1 0.75 0.50 0.25

P Q P s Q s s

H L H H eq

) (   

QH QL P

slide-25
SLIDE 25

25

PWM-like execution

Q Q P Q  ) (

Given (sL, sH), how to find (QL, QH) that produce seq?

L H L H H L H H eq

s P Q s s P Q P s Q s s       ) ( ) (           

L H L eq H

s s s s P Q  

L H

PWM-like execution

s

1

Considering transition overhead: QH QL t

1 0.75 0.50 0.25

  • HL
  • LH

Further details on:

  • E. Bini, G. Buttazzo, G. Lipari, "Minimizing CPU energy in real-time systems with

discrete speed management", ACM Trans. on Embedded Computing Systems, 8(4), 2009.

L H HL L L LH H H eq

Q Q

  • Q

s

  • Q

s s      ) ( ) (

slide-26
SLIDE 26

26

Supply function

sbf(t)

seq (QH + QL) sL (QL – oHL)

eq (QH

QL)

t

  • max

QL – oHL QH – oLH

  • min

Example 1

Suppose that the CPU has the following five modes of

  • peration:

Mode Power (mW) ACTIVE (s = 1) 100 ACTIVE (s = 0 75) 60

  • peration:

ACTIVE (s = 0.75) 60 ACTIVE (s = 0.5) 30 ACTIVE (s = 0.25) 15 SLEEP 4

And consider the following application:

1

S = 1 10 10 10

10

1 1 

C

1

2

40 80 120 60

30 30

U1 = 1/4 + 1/2 = 0.75

1

30

1 2 

C

n i i i

T C U

1 1 1

slide-27
SLIDE 27

27

Example 1

Note that:

s U sT C T s C s U

n i i i n i i i 1 1 1 1

) ( ) (   

 

 

For the feasibility (under EDF), it must be:

1 ) (

1

  s U s U 75 .

1 

 U s

Hence, it must be:

Therefore, the only feasible speeds for the given application are s = 1 and s = 0.75.

Executing at s = 1

1 2

40 80

10 10 10 30 30

S = 1 P (mW)

100 80

2

120 60

t

20 60 40

T

E = 100 T

slide-28
SLIDE 28

28

1 2

40 80

10 10 10 30 30

S = 1

Exploiting the sleep state

100 80

P (mW)

2

120 60

100 100

20 60 40

E = (1000.75 + 40.25)T = 76 T 4 4

t T

1 2

40 80

10 10 10 30 30

S = 1

Executing at s = 0.75

S = 0.75

120 60 40 80

1 2

13 13 13 40 40 2

120 60

P ( W)

20 60 40

P (mW)

60 E = 60 T

t T

slide-29
SLIDE 29

29

1 2

12 24

3

S = 1

Example 2

3 3 6 6 2

36 18

6 6

U1 = 1/4 + 1/3 = 0.583

Mode Power (mW) ACTIVE (s = 1) 100 ACTIVE (s = 0.75) 60 ACTIVE (s = 0.5) 30

 U1 0 583

In this case, it must be:

ACTIVE (s = 0.25) 15 SLEEP 4

s  U1 = 0.583 Therefore, the feasible speeds that guarantee the feasibility of the application are s = 1 and s = 0.75.

S = 0.75

1

4

Executing at s = 0.75

12 24

4 4

2

60 40

P (mW)

60

12 24

8 8

36 18

20 40

E = 60 T

t T

78 . 9 7 75 . 12 / 7 ) (

1

    s U s U

slide-30
SLIDE 30

30

S = 0.75

1

4

s = 0.75 + sleep state

12 24

4 4

2

60 40

P (mW)

12 24

8 8

36 18

20 40

t T

E = [60U + 4(1-U)]T = 47.56 T

Break even time

Considering the

  • verheads

involved in transitions, the minimum interval that justifies a transition to a low-power state is called Break-even time. If a and a are the time overheads required to perform a complete transition from an active state a to a sleep state  and back, the Break-even time is given by: Be(a,) = a + a a a time P(a) P()

slide-31
SLIDE 31

31

S = 0.75

1

4

s = 0.75 + sleep state

12 24

4 4

2

60 40

P (mW)

12 24

8 8

36 18

if Be = 2

20 40

t T E = [60U + 4(1-U) + 2(Be/T)(60-4)]T = 53.78 T

Compacting idle times

To minimize the transition overhead and better exploit sleep states, it is better to switch for long time intervals, rather then switching several times for short intervals. g [Bambagini et al., SIES 2013] proposed a technique to prolong idle intervals by delaying start times as much as possible, using blocking tolerance. 1 2

10 20

2

15 30 10 20 blocking tolerance 15 30 blocking tolerance

slide-32
SLIDE 32

32

Idle time from the scheduler

So, instead of executing tasks according to the scheduler, tasks are delayed to make idle times as large as possible. S = 0.75

1 2

4

P (mW)

12 24

4 4 8 8

36 18

20 60 40

P (mW) t T E = [60U + 4(1-U) + 2(Be/T)(60-4)]T = 53.78 T

Compacted idle times

So, instead of executing tasks according to the scheduler, tasks are delayed to make idle times as large as possible. S = 0.75

1 2

4

P (mW)

12 24

4 4 8 8

36 18

20 60 40

P (mW) t T E = [60U + 4(1-U) + (Be/T)(60-4)]T = 50.67 T

slide-33
SLIDE 33

33

Task harmonizing

[Rowe et al., TII-6(3), 2010] merge idle intervals by a virtual sleep task sleep with period TH (harmonizing period). period TH (harmonizing period). Jobs become eligible at the next nearest activation of sleep.

Be = 5

5 10 15 20 25 30 35 40 45 50 55 60

T

sleep = 10 5 10 15 20 25 30 35 40 45 50 55 60

Exploiting early completions

Since mostly jobs execute much less than their WCET, the saved execution can be exploited to further reduce the speed or prolong sleep intervals (depending on the architecture). If (s* < 1) If (s* = 1)

slide-34
SLIDE 34

34

Early completions on DVFS

1

S = 0.75

40 80

(10/40)

13 13 13

 (10/40) 2

120 60

(30/60) S = 0.75 S = 0.5 S = 0.33

13 20 40 40

120 60 40 80

1 2

(10/40) (30/60) S = 0.75 S = 0.75

13 20 30 23 34

1

S = 1

40 80

(10/40)

10 10 10

10 20

Early completions on DPM

2

120 60

(30/60)

30 30

1

S = 1 (10/40)

10 10 5

45

1 2

40 80 120 60

(10/40) (30/60)

20 30 10 10 5