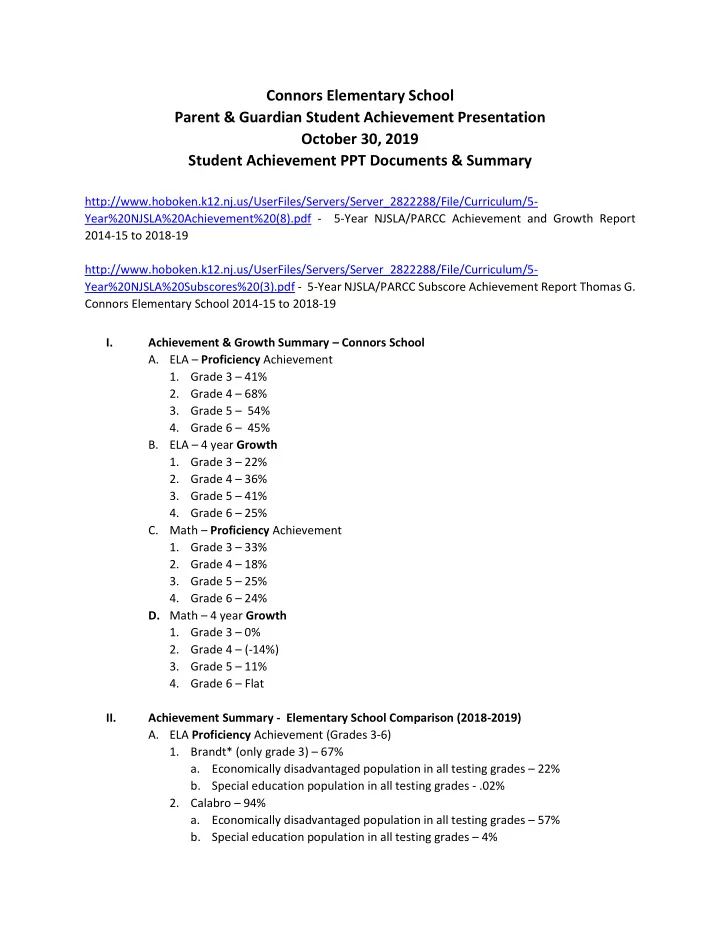

Connors Elementary School Parent & Guardian Student Achievement Presentation October 30, 2019 Student Achievement PPT Documents & Summary http://www.hoboken.k12.nj.us/UserFiles/Servers/Server_2822288/File/Curriculum/5- Year%20NJSLA%20Achievement%20(8).pdf - 5-Year NJSLA/PARCC Achievement and Growth Report 2014-15 to 2018-19 http://www.hoboken.k12.nj.us/UserFiles/Servers/Server_2822288/File/Curriculum/5- Year%20NJSLA%20Subscores%20(3).pdf - 5-Year NJSLA/PARCC Subscore Achievement Report Thomas G. Connors Elementary School 2014-15 to 2018-19 I. Achievement & Growth Summary – Connors School A. ELA – Proficiency Achievement 1. Grade 3 – 41% 2. Grade 4 – 68% 3. Grade 5 – 54% 4. Grade 6 – 45% B. ELA – 4 year Growth 1. Grade 3 – 22% 2. Grade 4 – 36% 3. Grade 5 – 41% 4. Grade 6 – 25% C. Math – Proficiency Achievement 1. Grade 3 – 33% 2. Grade 4 – 18% 3. Grade 5 – 25% 4. Grade 6 – 24% D. Math – 4 year Growth 1. Grade 3 – 0% 2. Grade 4 – (-14%) 3. Grade 5 – 11% 4. Grade 6 – Flat II. Achievement Summary - Elementary School Comparison (2018-2019) A. ELA Proficiency Achievement (Grades 3-6) 1. Brandt* (only grade 3) – 67% a. Economically disadvantaged population in all testing grades – 22% b. Special education population in all testing grades - .02% 2. Calabro – 94% a. Economically disadvantaged population in all testing grades – 57% b. Special education population in all testing grades – 4%
3. Connors – 50% a. Economically disadvantaged population in all testing grades – 89% b. Special education population in all testing grades – 19% 4. Wallace – 55% a. Economically disadvantaged population in all testing grades – 43% b. Special education population in all testing grades – 24% III. Achievement Summary - Elementary School Comparison (2018-2019) B. Math Proficiency Achievement (Grades 3-6) 5. Brandt* (only grade 3) – 83% a. Economically disadvantaged population in all testing grades – 22% b. Special education population in all testing grades - .02% 6. Calabro – 60% a. Economically disadvantaged population in all testing grades – 57% b. Special education population in all testing grades – 4% 7. Connors – 25% a. Economically disadvantaged population in all testing grades – 89% b. Special education population in all testing grades – 19% 8. Wallace – 46% a. Economically disadvantaged population in all testing grades – 43% b. Special education population in all testing grades – 24% IV. 2014-2015 to 2018-2019 Achievement Growth Summary All Grades – Conners School A. School-wide ELA Growth – 29% B. School-wide Math Growth – Flat V. Achievement Summary – District (3-12) for (2018-2019) v. State A. ELA District (2018 – 2019) 53% B. Math District (2018 – 2019) 30% VI. 2014-2015 to 2018-2019 Achievement Growth Summary – District (3-12) A. ELA – 23% B. Math – 8% VII. Race Sub-Scores A. 2018-2019 ELA Proficiency Achievement Summary All Grades – Connors School 1. Asian (0% of Testing Grades) – 0% 2. Black (33% of Testing Grades) – 38% 3. Hispanic (59% of Testing Grades) – 56% 4. Multi (1% of Testing Grades) – 100% 5. White (6% of Testing Grades) – 57%
B. 2018-2019 Math Proficiency Achievement Summary All Grades – Connors School 1. Asian – (0% of Testing Grades) - 0% 2. Black – (33% of the Testing Grades) - 19% 3. Hispanic – (59% of Testing Grades) - 27% 4. Multi – (1% of Testing Grades) - 0% 5. White – (6% of Testing Grades) - 43% VIII. Gender Sub-Scores – Females are 49% of Testing Grades & Males are 51% of Testing Grades A. 2018-2019 ELA Proficiency Achievement Summary All Grades – Connors School 1. Female – 56% 2. Male – 46% B. 2018-2019 Math Proficiency Achievement Summary All Grades – Connors School 1. Female – 24% 2. Male – 26% IX. Special Education Scores – 19% of Testing Grades A. 2018-2019 ELA Proficiency Achievement Summary All Grades – Connors School 1. Special Education – 33% 2. Regular Education – 54% B. 2018-2019 Math Proficiency Achievement Summary All Grades – Connors School 1. Special Education – 19% 2. Regular Education – 27% X. Economically Disadvantaged Scores (No Comparative Data is Provided) – 89% of Testing Grades A. 2018-2019 ELA Proficiency Achievement Summary All Grades – Connors School 1. Economically Disadvantaged – 49% B. 2018-2019 Math Proficiency Achievement Summary All Grades – Connors School 1. Economically Disadvantaged – 23% XI. 2018- 2019 ESSA District Accountability Profile (Federal Govt’ Uses 2018 Data) A. Participation Rate ELA (Met 95% Standard) – Yes B. Participation Rate Math (Met 95% Standard) – Yes C. Academic Achievement ELA (Met Target) – Yes D. Academic Achievement Math (Met Target) – Yes E. Academic Progress ELA (Met Standard) – Yes F. Academic Progress Math (Met Standard) – Yes
Recommend
More recommend