Conference on Predicting Cell Metabolism and Phenotypes Barry - - PowerPoint PPT Presentation
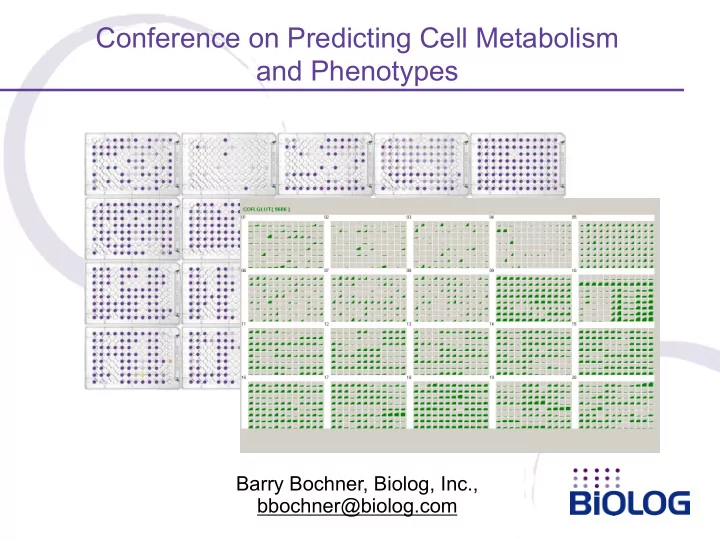
Conference on Predicting Cell Metabolism and Phenotypes Barry Bochner, Biolog, Inc., bbochner@biolog.com Brief History of Metabolic Phenotypic Analysis In the beginning The cell was a black box Early Beginnings of Metabolic Description of
Brief History of Metabolic Phenotypic Analysis
In the beginning …
The cell was a black box
Early Beginnings of Metabolic Description of Cells
Bergey’s Manual 1st Edition, 1923
- L. E. den Dooren de Jong
Survey of C-Source and N-Source Utilization, 1926
- B. coli M. phlei
Analogy #1 Metabolic Circuitry Resembles Electronic Circuits
View of Cells circa 1960
Regulatory Complexity Added to Circuitry, circa 1970
A B C D E F G
feedback inhibition, synthetic pathways feedforward activation, catabolic pathways
Feedback and feedforward open up the possibility of oscillations
Metabolic Oscillations
A single gene mutation causes cell growth to oscillate !
Histidine limitation Histidine secretion
Metabolism Resembles Electronic Circuit Diagrams
Electrical Components Biological Components
Dehydrogenases Polymerases Isomerases Kinases Glycosidases Hydrolases Phosphatases Epimerases Phosphorylases Transferases Peptidases Proteases Oxidoreductases Lyases Aldolases Ligases Hydroxylases Cyclases
Higher Order Understanding of Electronic Circuits
Amplifier Receiver Rectifier Oscillator Integrator Comparator Counter Filter
Higher Order Understanding of Cells: Physiology
- Growth is a property common to all cells
- Cell growth is primarily polymer synthesis:
DNA, RNA, protein, membranes, wall, storage polymers
- The polymers are made by assembling subunits:
deoxynucleotides, ribonucleotides, amino acids, etc.
- The subunits are made from C, N, P, S, O, H
My Discovery of a Colorimetric Readout of Cell Metabolism - 1975
Metabolism of C-sources Produces an Electron Flow
Redox Dye histidine
Using a Redox Dye to Detect Metabolic Flux
Biolog uses a redox reporter dye that detects energy (NADH) production
TVox TVred
Redox Chemistry Measures Cell Energetics
Add cells Add redox dye Wells contain different tests and measure different pathway activities and phenotypes of cells
Stimulatory chemicals enhance energy production inhibitory chemicals block energy production
Microplate containing a negative control well and 95 different carbon substrates
PM Platform - ~2,000 Phenotypic Assays, circa 2000
Carbon Pathways Nitrogen Pathways Sensitivity to 240 Chemicals N P S Osmotic & Ion Effects pH Effects Biosynthetic Pathways
PM Platform - Pathway Readout
C N P S K Na Mg Ca Fe aa vit
- +inh
complete medium
It is like having a flux meter to measure individual pathways
Analogy #2 The Cell Resembles a Signal Processor
Nutritional signals (C, N, P, S) Environmental signals (temperature, salt, pH, light)
ENERGY
From a Redox Color Change to Scanning Cell Physiology
2 Components of the PM Cell Assay Platform
colorimetric cell assays in 96-well microplates incubation and recording of data in the OmniLog Phenotype MicroArrays™ OmniLog™ Incubator/Reader
Chemicals that stimulate cells Chemicals that inhibit cells
PM Assays are Easy to Run
OmniLog PM System Holds 50 microplates at a set temperature and measures color formation at 15-minute intervals Kinetic assay readout for up to 5,000 wells CVs typically < 10% Assays Initiated by adding cells to wells 100 µl per well
PM Analysis of Corynebacterium glutamicum
N-acetyl neuraminic acid glucose sucrose inositol acetoacetate acetate 4- hydroxybenzoate glutamine urea chorismate ammonia asparagine aspartate ser- peptides
- smo-
tolerant
PM Platform - Comparing Two Cell Lines
Add cell A Add cell B PM Kinetic Result PM Pattern OmniLog PM System
PM Platform – Comparing Two Assay Conditions
PM Pattern OmniLog PM System PM Kinetic Result
1 hr Automatic 24-48 hr
Plus/Minus a gene Plus/Minus a drug Plus/Minus an environmental change
Analyzing Gene Function: Metabolic Genes and Drug Resistance Genes
- E. coli malF::Tn10 vs MG1655
tetracyclines tetracycline s Green = Phenotypes Gained Dextrin Maltose Maltotriose Red = Phenotypes Lost
Name Strain Number Other Test EP005 MG1655 malF3089::Tn10 Ref MG1655FB 1998 version E.coli Phenotypes Gained - Faster Growth / Resistance PM Wells Test Difference Mode of Action PM16 B 3 Norfloxacin 75 DNA topoisomerase, quinolone PM20 F 6, F 7, F 8 Oxytetracycline 239 protein synthesis, tetracycline PM12 B 7, B 8 Penimepicycline 207 protein synthesis, tetracycline PM13 D 11, D 12 Rolitetracycline 183 protein synthesis, tetracycline PM12 A 7, A 8 Tetracycline 182 protein synthesis, tetracycline PM13 C 6, C 7 Doxycycline 177 protein synthesis, tetracycline PM11 D 8 Demeclocyline 104 protein synthesis, tetracycline PM11 A 7, A 8 Chlortetracycline 94 protein synthesis, tetracycline PM11 H 3, H 4 Cephalothin 127 wall, cephalosporin Phenotypes Lost - Slower Growth / Sensitivity PM Wells Test Difference Mode of Action PM02 A 6 Dextrin
- 100
C-source PM01 E 10 Maltotriose
- 89
C-source PM01 C 10 Maltose
- 78
C-source PM04 A 5 Tripolyphosphate
- 63
P-source PM16 E 2 Streptomycin
- 133
protein synthesis, aminoglycoside
Analyzing Regulatory Genes
- E. coli oxyR::kan vs MG1655
amino-glycosides t-butyl hydroquinone, plumbagin, lawsone
Analyzing Genes of Unknown Function
- E. coli b1012 Operon is Regulated by NtrC
b1006- b1012 Low, Kustu, and coworkers PNAS (2006) 103:5114
PM Analysis of Changes in N-metabolism
Nitrogen Metabolism E. coli b1012 Operon Knockout, 25˚C
- cytosine uracil, uridine
The b1012 operon was noted
- n E. coli gene chips to be
highly regulated by the ntrC (glnG) system. Homology data for b1006 indicated similarity to a nucleobase transporter.
- Low, Kustu, and coworkers PNAS (2006) 103:5114
New Pyrimidine Catabolic Pathway Discovered
Low, Kustu, and coworkers PNAS (2006) 103:5114
Analyzing Regulation of Metabolism
Coordination of N-Metabolism with C-Metabolism
- E. coli S. aureus
succinate glucose pyruvate glucose
NH3 amino acids peptides purines amino sugars peptides amino acids peptides NH3 urea D-serine
Biolog N-Source plate (PM3) tested with different C-Sources
Oxygen Effects on E. coli C-Metabolism
- E. coli BW30270 anaerobic (left) vs aerobic (right)
PM1 incubated for 46 hours at 36° C
Under anaerobic conditions, the following C-sources are not metabolized: A5= succinic acid, A7= L-aspartic acid, A9= D-alanine, B3= glycerol, B7= a-glycerol- PO4, B9= L-lactic acid, B10= formic acid, C3= D,L-malic acid, C8= acetic acid, D1= L-asparagine, D6= a-keto-glutaric acid, E1= L-glutamine, E2= m-tartaric acid, E6= a-hydroxy-glutaric acid lactone, E7= a-hydroxy-butyric acid, F1= glycyl-L-aspartic acid, F5= fumaric acid, F6= bromo-succinic acid, F7= propionic acid, F9= glycolic acid, F10= glyoxylic acid, G1= glycyl-L-glutamic acid, G4= L-threonine, G5= L- alanine, G6= L-alanyl-glycine, G8= N-acetyl-b-D-mannosamine, G11= D-malic acid, G12= L=malic acid, H1=glycyl-L-proline.
pH Effects on E. coli: pH7 vs pH5
metal chelators and
- xidizing
agents tween 20, D-arabinose, b-hydroxy-butyrate Nitrite as N- source 10-100mM Na Nitrate 10-100mM Na Nitrite
at acidic pH, NO3
- NO2
- HNO2 (nitrous acid) and NO (nitric oxide)
Temperature Effects on C-Metabolism
1087 15464 (type) 15478 F6P fumarate aspartate malate G1P F6P G6P F6P
Recent results show that Yersinia has a temperature sensing protein, RovA, that is an important regulator of pathogenicity
Yersinia pseudotuberculosis strains: 26°C vs 33°C
Light and C-Source Effects on Conidiation
Freidl, MA, Kubicek, CP, and Druzhinina, IS, Applied Environ. Micro. Jan. 2008. Using the fungus Hypochrea atroviridis, which is a model organism for both cellulose degradation and photomorphogenesis, the authors showed that, contrary to common dogma, C-source has a much more profound effect on conidiation than light exposure.
Analogy #3 Cells are Multi-State Automata
g g g g g g g g g g g g
All Cells Change with Culture Conditions
PM Platform - ~2,000 Culture Conditions
Carbon Pathways Nitrogen Pathways Sensitivity to 240 Chemicals N P S Osmotic & Ion Effects pH Effects Biosynthetic Pathways 2,000 Versions of the Cell
Changes in S. cerevisiae with Culture Conditions
Induced by Growth on Different Carbon Sources
Slide generously provided by Richard Rachubinski
Induction of peroxisomes
glucose oleic acid
Changes in C. albicans with Culture Conditions
- N. C. Hauser, et al., Screening (2002) 4:28-31
Non-pathogenic form Pathogenic form
Phenotype MicroArray Technology in Systems Biology Modeling of Cell Metabolism
Using PM to Improve Annotation and Modeling
Oh, Palsson, Park, Schilling, Mahadevan JBC, 2007, 39:28791-28799
Steps in BioProcess Development Aided by PM
- Efficiently optimize many aspects of bioprocesses
- Characterize cell lines to select the best one to use
- Understand the culture properties of any cell line
- Understand how genetic changes affect the cell line
- Simulate hundreds/thousands of culture conditions: both
the growth phase and production phase
- Optimize culture conditions for both rapid growth and
maximum product
- Use it as a QC tool to test stock and inoculum cultures,
improve process consistency, and ID contaminants
Microscale Analysis of Cell Productivity - Wyeth
- M. Singh,
- J. Micro.
Methods (2009) 77:102
Some Major Challenges and Gaps in Cell Modeling
Making Phenotypic Maps
gene 1 phenotype 1 g2 g3 g4 g5 p2 p3 p4-8 p9 p2 p7
The more phenotypes that
- ne can measure, the
more completely one can describe a microorganism
- r mammalian cell and the
more completely you can describe its genome. We need phenotypic maps to enhance genomic maps. More is better – both in quantity and variety. Ideally one would like to have a universal phenotyping set.
Annotation of Transporter Genes in P. aeruginosa
- Ian Paulsen and coworkers (PLoS Genetics, Sept. 2008)
examined phenotypes of knockouts of transporter genes and compared them with functional annotations based on DNA homology.
- Only 12/27 (44%) precisely matched predicted annotation
- In 10/27 (37%) a more precise annotation was obtained
- In 5/27 (18%) a significant reannotation was enabled
- Novel transporters were identified for L-glutamate, N-acetyl-
L-glutamate, hydroxy-L-proline, and histamine
Integrating Information from OMICs Analysis
DNA RNA PROTEIN PHENOTYPE
O’Farrell, 1975 Molecular Analyses Affymetrix, 1993 Cellular Analysis Biolog, 2000
Transcriptomics Proteomics Phenomics
Addressing Other Complexities to Metabolic Regulation
- Feedback, feedforward, cross pathway regulation
- Isozyme regulation
- Global signaling with Alarmones (e.g. cAMP)
- Transcriptional regulation (E. coli has 288 trans factors)
- Regulatory RNAs (e.g. riboswitches and microRNAs)
- Modulation of transcription (e.g. histone acetylation)
- Modulation of enzyme activity (e.g. phosphorylation,
acetylation, adenylation, uridylation)
- Undiscovered pathways and genes of unknown function
- Relating models to cell physiology
What Should Our Research Priorities Be ?
Acknowledgements
- Funding from NIH ( NIGMS, NIAID, NCI, NIMH)
- Also DOE and NASA and NSF
- All of my colleagues past and present at Biolog, Inc.
Metabolic and Phenotypic Analysis and Identification of Microbial and Mammalian Cells
Barry Bochner, PhD CEO & CSO Biolog, Inc
Drug Testing with PM Technology
With Drug (various concentrations) OmniLog PM System PM Kinetic Result Without Drug
Drug vs Phenotype Titration
10µM 100µM 1000µM
Inhibitors Knockout Various Pathways
X X X X X X X X X X X X
Simulating Global Metabolism
Accidental Discovery in 1975
Histidine non-metabolizing colonies (hut-) are white Histidine metabolizing colonies (hut+) are red
This discovery became my first scientific publication, most of my PhD dissertation, most of my scientific career
Tetrazolium Redox Dyes as Universal Indicators
Colonies with red centers indicate metabolism of the carbon source
Accidental Discovery in 1975
Histidine non-metabolizing colonies (hut-) are white Histidine metabolizing colonies (hut+) are red
Electron Flow from C-source to Redox Dye
Carbon Growth NADH TVred (purple) Electron transport in membrane or mitochondria TVox (colorless) Catabolism TVred (purple) Growth NADH Carbon Carbon Transport
Electron Flow from C-source to Redox Dye
Carbon Growth NADH TVred (purple) Electron transport in membrane or mitochondria TVox (colorless) Catabolism TVred (purple) Carbon Carbon Transport Check Point for N, P, S
Electron Flow from C-source to Redox Dye
Carbon Growth NADH TVred (purple) Electron transport in membrane or mitochondria TVox (colorless) Catabolism TVred (purple) Carbon Carbon Transport Check Point for N, P, S
Electron Flow from C-source to Redox Dye
Carbon TVred (purple) Electron transport in membrane or mitochondria TVox (colorless) Carbon Transport Carbon Catabolism Checkpoint for N, P, S N TVred (purple) NADH Carbon P S
Electron Flow from C-source to Redox Dye
Carbon TVred (purple) Electron transport in membrane or mitochondria TVox (colorless) Carbon Transport Carbon Catabolism Checkpoint for N, P, S N TVred (purple) NADH Carbon P S
Microbiology Test Kits in the 1970s
“Clinical systems” use pH indicators (which only work well for acid- producing species) and assorted chromogenic tests (which must be invented and developed one-at-a-time)
Characterization of Fermentation Strains
PM Analysis of Streptomyces coelicolor
- smotically sensitive except to
urea succinate mannitol glutamate gelatin nitrite, urea prototrophic glycerol tweens lactose gentiobiose most amino acids (not met) no met peptide s