
SLIDE 1
Comstock Holding Companies, Inc. Investor Presentation
JUNE 30, 2019
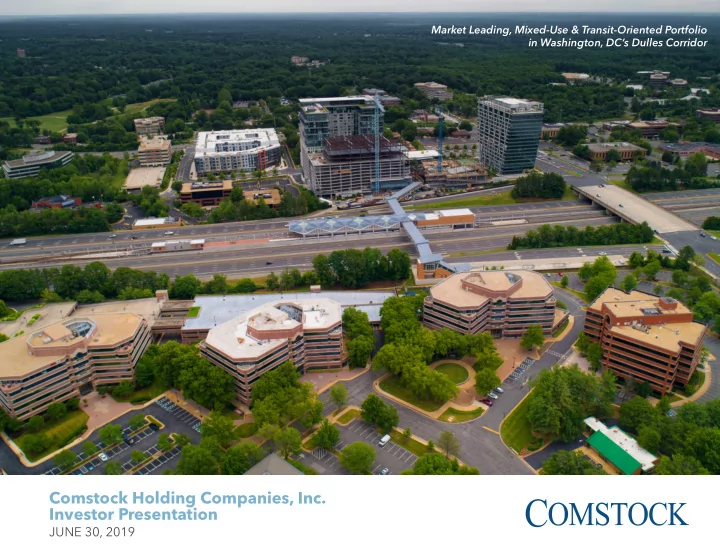
Market Leading, Mixed-Use & Transit-Oriented Portfolio in Washington, DC’s Dulles Corridor
Comstock Holding Companies, Inc. Investor Presentation JUNE 30, - - PowerPoint PPT Presentation
Market Leading, Mixed-Use & Transit-Oriented Portfolio in Washington, DCs Dulles Corridor Comstock Holding Companies, Inc. Investor Presentation JUNE 30, 2019 DISCLOSURES This release includes forward-looking statements that are
JUNE 30, 2019
Market Leading, Mixed-Use & Transit-Oriented Portfolio in Washington, DC’s Dulles Corridor
This release includes “forward-looking” statements that are made pursuant to the safe harbor provisions of the Private Securities Litigation Reform Act of 1995. These forward-looking statements can be identifjed by use of words such as “anticipate,” “believe,” “estimate,” “may,” “intend,” “expect,” “will,” “should,” “seeks” or other similar expressions. Forward-looking statements are based largely on our expectations and involve inherent risks and uncertainties, many of which are beyond our control. You should not place undue reliance on any forward-looking statement, which speaks only as of the date made. Additional information concerning important risks and uncertainties can be found under the heading “Risk Factors” in our most recent Annual Report on Form 10-K, as fjled with the Securities and Exchange Commission. Our actual results could differ materially from these projected or suggested by the forward-looking statements. Comstock claims the protection of the safe harbor for forward-looking statements contained in the Private Securities Litigation Reform Act of 1995 for all forward-looking statements contained herein. Comstock specifjcally disclaims any obligation to update or revise any forward-looking statements, whether as a result of new information, future developments or otherwise. While every attempt has been made to ensure the accuracy of included measurements, all future development measurements are based on available information at the time of production of this Investor Presentation and therefore all square foot measurementsare subject to change without notice.
2 JUNE 30, 2019
urban transformation of one of the most dynamic real estate markets in the nations, Washington, DC’s Dulles Corridor, where it controls a stabilized portfolio and fully entitled development pipeline that includes ~7 million square feet of mixed-use and transit-oriented properties located adjacent to key Metro Stations
in the Dulles Corridor, coupled with its multiple revenue sources and its profjts interest in the Anchor Portfolio provide a platform for additional growth and an opportunity to enhance shareholder value
(NASDAQ: CHCI) is a diversifjed real estate developer and asset manager with a 30+ year track record of successfully investing in, developing, and operating residential, commercial, mixed-use, and transit-oriented real estate, delivering thousands of residential units and millions of square feet of mixed-use and transit-oriented assets while earning its reputation as a premier real estate developer and operator in the Washington, DC region
manages real estate for its own account, as fund sponsor, asset manager, and as managing partner
(“P3”), aligning its interests with stakeholders by investing alongside in the real estate acquisitions and developments that it sources
stakeholders through the thoughtful design, development and operation
with a focus on indenitfying unique
to capitalize on emerging trends and to produce above average returns
created through its development and asset management services related to the Anchor Portfolio in the Dulles Corridor where Metro’s new Silver Line provides rail service connecting Reston to Tysons and Washington, DC and is currently being expanded to connect to Dulles International Airport and Eastern Loudoun County
A PLATFORM FOR GROWTH THAT CREATES VALUE FOR ALL STAKEHOLDERS
3 JUNE 30, 2019
IN APRIL 2019, COMSTOCK ANNOUNCED COMPLETION OF A SERIES OF TRANSACTIONS THAT ACCOMPLISHED:
for-sale homebuilding unit, reducing exposure to highly volatile for-sale market
associated with legacy homebuilding
resulting from ~$18.5M of prior capital investments in homebuilding assets
agreement (“2019 AMA”) that increases revenue opportunities associated with anchor portfolio of assets under management
management agreement (“2018 AMA”) and its cost-plus revenue feature with a modifjed market rate fee structure that preserves the stability of the cost-plus feature but removes the revenue cap element of the 2018 AMA
investment-grade, transit-oriented and mixed-use assets encompassing more than 2,800 multi-family units, Class A and Trophy offjce, destination retail, hotels, and commercial parking garages located at two Metro stops
Corridor
have an estimated value of $2.5 to $3.0 Billion at full build out
4 JUNE 30, 2019
increases return on invested capital while generating multiple new revenue sources
development pipeline at key Metro stations in Washington, DC’s Dulles Corridor
management agreement provides reliable asset management fee-based revenue and upside participation while providing downside protection through cost-plus provision
provided to family offjces, institutional investors, lenders,
estate interests provides reliable long-term revenue opportunities, with “promote” providing upside participation
services, including; development services, property management, loan originations, and fjnancial consulting services enhance revenue
services, including; entitlement management services, environmental consulting and environmental remediation services provides additional high-margin revenue
generates healthy gross margins and is designed for growth with minimal capital outlay while highly fractured nature of industry provides potential acquisition opportunities
NEW STRATEGY GENERATES NEW REVENUE SOURCES
5 JUNE 30, 2019
Wholly owned subsidiary, Comstock Asset Management, LC, manages the anchor portfolio including ~7M square feet of institutional quality mixed-use and transit-oriented assets (stabilized, under construction, and scheduled to begin construction during the next several years) in the Dulles Corridor of the Washington, DC region. The term of the Anchor Asset Management Agreement runs through 2027 Asset management fees are calculated as the greater of the annual operating costs of Comstock Holding Companies, Inc, plus $1,000,000 or the aggregate of the market rates fees, including:
In addition, a “Promote” incentive fee equal to a percentage of the free cashfmow generated by each managed asset above the applicable prescribed preferred return on invested capital
ANCHOR PORTFOLIO PROVIDES GROWTH OPPORTUNITY
6 JUNE 30, 2019
Wholly owned subsidiary, Comstock Real Estate Services, LC generates fee-based revenue from its various business interests, which include:
benefjt capital stack of managed assets
stack of managed assets
New Jersey and Pennsylvania
ANCHOR PORTFOLIO PROVIDES PLATFORM FOR GROWTH
7 JUNE 30, 2019
Q1 2018 CURRENT
COMMERCIAL 958,000 SF 2,350,000 SF MULTIFAMILY 2,000,000 SF 3,400,000 SF HOTELS 500,000 SF RETAIL 314,000 SF 450,000 SF TOTAL SF 3,272,000 SF 6,700,000 SF Number of commercial assets 7 13 Number of multifamily assets 6 (1,400 units) 10 (2,800 units) Number of hotel assets 0 (0 Keys) 2 (400 Keys) TOTAL number of assets 13 25
Figures are approximate and include future development assets. 8 JUNE 30, 2019
SQFT (millions) Under construction / Current development pipeline Operating
2.0 3.0 4.0 5.0 6.0 7.0 2019 2020 2021 2022 2023 2024 2025
Figures are approximate and include future development assets. 9 JUNE 30, 2019
CHRIS CLEMENTE
Chairman & CEO 35 years industry experience
JOSEPH SQUERI
Director & EVP of Strategy and Corporate Development 32 years industry experience
CHRISTOPHER GUTHRIE
CFO & EVP 18 years industry experience
TIMOTHY STEFFAN
EVP of Asset Management, Leasing & Development 21 years industry experience
JUBAL THOMPSON
General Counsel & EVP 20 years industry experience
RANDI KILLEN
SVP of Human Resources 17 years industry experience
10 JUNE 30, 2019
MIKE DAUGARD
SVP of Acquisition 20 years industry experience
MICHAEL GUALTIERI
SVP of Finance & Corporate Controller 15 years industry experience
TRACY SCHAR
SVP of Marketing & Brand Management 30 years industry experience
TRACY GRAVES
SVP Entitlements & Development 35 years industry experience
KRIS GREEN
VP of Residential Property Management 11 years industry experience
KIMBERLEY SINKOVIC
VP of Commercial Property Management 19 years industry experience
11 JUNE 30, 2019
PORTFOLIO OVERVIEW
COMMERCIAL ASSETS 13 COMMERCIAL SF 2.4MM MULTIFAMILY ASSETS 10 MULTIFAMILY UNITS 2,800+ RETAIL SF 450K HOTEL SF 500K
HERNDON STATION
Figures are approximate and include future development assets. 12 JUNE 30, 2019
13 JUNE 30, 2019
COMMERCE DISTRICT METRO PLAZA
WIEHLE AVE D U L L E S T O L L R O A D
Reston Station is among the largest mixed-use, transit-oriented developments in the Washington D.C. MSA Located midway between Dulles Airport and Tyson’s Corner, the urban core of Reston Station sits atop the only fully integrated transit facility in Northern VA The Wiehle Reston-East Station is situated at center of Reston Station and accommodates upwards of 25,000 daily commuters The nearly 40 acre Reston Station neighborhood is being developed in four distinct districts:
RESTON STATION ASSETS OVERVIEW
4.5–5MM SF MIXED USE DEVELOPMENT 2MM SF TROPHY-CLASS & CLASS-A OFFICE 210K SF RESTAURANTS, DESTINATION RETAIL 400+ KEYS FULL SERVICE & EXTENDED STAY HOTELS 1,600+ RESIDENTIAL UNITS 7,450+ PARKING SPACES
14 JUNE 30, 2019