
SLIDE 1
CHCI
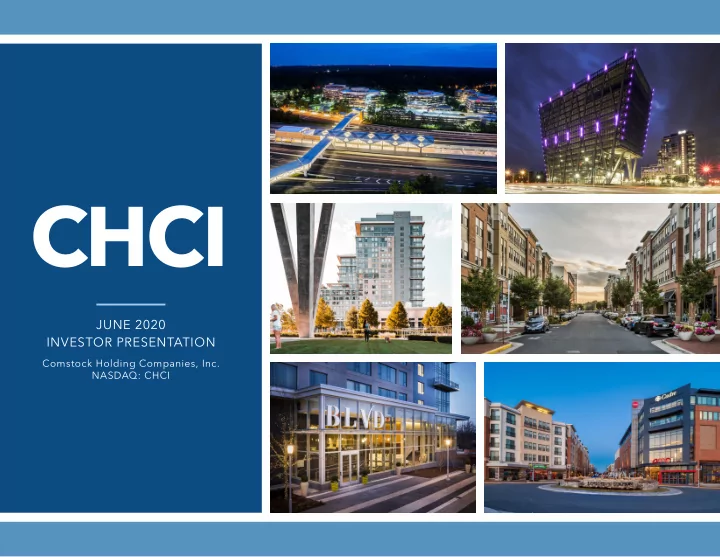
JUNE 2020 INVESTOR PRESENTATION
Comstock Holding Companies, Inc. NASDAQ: CHCI
CHCI JUNE 2020 INVESTOR PRESENTATION Comstock Holding Companies, - - PowerPoint PPT Presentation
CHCI JUNE 2020 INVESTOR PRESENTATION Comstock Holding Companies, Inc. NASDAQ: CHCI Disclosures This release includes forward-looking statements that are made pursuant to the safe harbor provisions of the Private Securities Litigation
JUNE 2020 INVESTOR PRESENTATION
Comstock Holding Companies, Inc. NASDAQ: CHCI
Disclosures
This release includes “forward-looking” statements that are made pursuant to the safe harbor provisions of the Private Securities Litigation Reform Act of 1995. These forward-looking statements can be identified by use of words such as “anticipate,” “believe,” “estimate,” “may,” “intend,” “expect,” “will,” “should,” “seeks” or other similar expressions. Forward-looking statements are based largely on our expectations and involve inherent risks and uncertainties, many of which are beyond our control. You should not place undue reliance on any forward-looking statement, which speaks only as of the date made. Additional information concerning important risks and uncertainties can be found under the heading “Risk Factors” in our most recent Annual Report on Form 10-K, as filed with the Securities and Exchange Commission. Our actual results could differ materially from these projected or suggested by the forward-looking statements. Comstock claims the protection of the safe harbor for forward-looking statements contained in the Private Securities Litigation Reform Act of 1995 for all forward-looking statements contained herein. Comstock specifically disclaims any obligation to update or revise any forward-looking statements, whether as a result of new information, future developments or otherwise. While every attempt has been made to ensure the accuracy of included measurements, all future development measurements are based on available information at the time of production of this Investor Presentation and therefore all square foot measurements are subject to change without notice.
2 JUNE 2020 Comstock at a Glance
A PLATFORM FOR GROWTH DESIGNED TO CREATE VALUE FOR ALL STAKEHOLDERS
Comstock Holding Companies, Inc. (NASDAQ: CHCI) is a leading developer, operator, and asset manager of mixed-use and transit-oriented properties in the Washington, D.C. area where we primarily focus on select high-growth urban and transitioning “sub-urban” markets. As a vertically integrated real estate operating company and investor, we have several revenue sources.
institutional real estate investors in offjce, retail, residential and mixed-use properties, generally retaining an economic interest for the Company and providing management services to those properties, enabling the Company to increase its assets under management (“AUM”).
the most dynamic real estate markets in the nation, Washington DC’s Dulles Corridor, where it is developing a ~7M square foot portfolio
Metro stations on the new Silver Line (the “Anchor Portfolio”).
transit-oriented submarket, the Rosslyn-Ballston Corridor, acquiring a 211,000 square foot offjce tower located at the Clarendon Metro station through a joint venture with institutional capital partners, retaining an economic interest and management responsibilities.
the operating partner for Public-Private Partnerships responsible for development of mixed-use and transit-oriented developments that include large-scale public infrastructure elements.
3101 Wilson Blvd @ Clarendon Metro 1900 Reston Metro Plaza @ Reston Station Metro 43805 Central Station Dr @ Ashburn Metro 3 JUNE 2020 Comstock at a Glance
5
BUILDINGS750K SF
ADDITIONS TO AUM$1.6M
ACQUISITION FEES~$285M
CAPITAL RAISED AND DEPLOYED$25.3M
2019 REVENUES$3.3M
2019 EBITDA$7M
Q1 2020 REVENUE$502K
Q1 2020 EBITDACUSTOMERS
Corporate Real Estate Owners Institutional Real Estate Investors Family Offjces Financial Institutions Governmental InstitutionsASSET TYPES
Mixed-Use Transit Oriented Retail Offjce Multifamily Hotel Parking Public InfrastructureSERVICES
Asset Management Asset Acquisition and Disposition Leasing and Marketing Design, Planning, and Entitlements Development and Construction Property Management Facility Management Environmental Engineering & COVID-19 Services1.4M
COMMERCIAL SF805
MULTIFAMILY UNITS600K+ SF
2019 AND YTD 2020 LEASING ACTIVITYOPERATING PORTFOLIO
454K
COMMERCIAL SF318
MULTIFAMILY UNITSUNDER CONSTRUCTION Delivering 2020 & 2021
1.8M
OFFICE AND RETAIL SF1,600
MULTIFAMILY UNITS2/450
HOTELS/KEYSFUTURE DEVELOPMENT PIPELINE
ASSETS UNDER MANAGEMENT CHCI 2019 + 2020 YTD ACQUISITIONS
82%
leased90%
leased79%
pre-leased *All totals are approximate and subject to change. 4 JUNE 2020 How Comstock Generates Revenues
ASSET MANAGEMENT SERVICES
management agreement through 2027 on the Anchor Portfolio, and pursuant to asset management agreements related to other properties on shorter term contracts
— Asset management fees as a percentage of managed portfolio revenues — Construction management fees as a percentage of costs associated with development of managed assets — Property management fees as a percentage of revenues generated by managed portfolio assets — Disposition fees as a percentage of the sales price of the disposition asset
for downside protection
above a specifjed preferred return on invested capital
COMSTOCK REAL ESTATE SERVICES (CRES)
brokerage, equity and debt originations, and title insurance services
remediation and industrial hygiene management services, including COVID-19 related services
personnel and serve as a potential catalyst for joint venture and strategic acquisitions
COMMERCIAL REAL ESTATE ACQUISITION FEE STREAM
Management Services As a vertically integrated real estate operating company and real estate investor, we generate revenue in several ways in connection with the properties we acquire, develop, and/or manage. Our multiple revenue sources generally include fee-based revenue generated by providing multiple services in connection with AUM properties, partnership income generated by co-investing with our institutional partners in certain AUM properties, performance-based incentive income generated when transaction related events occur and when the performance of an AUM property meets certain fjnancial metrics, and income generated by providing supplemental real estate related services, including environmental remediation and COVID-19 related services.
5 JUNE 2020 Comstock Fee Structure
ASSET MANAGEMENT FEES SUPPLEMENTAL FEES
Asset Management Property Management Development + Construction Management Acquisition Disposition Promote Incentive Fee Loan Origination Equity Investment Origination Leasing ManagementANCHOR PORTFOLIO (*) - FULL SERVICE ASSET MANAGEMENT CONTRACTS
Reston / Loudoun Station Offjce X X X X X X X Residential X X X X X X X Retail X X X X X X X Parking X X X X X X X Reston / Loudoun Station Offjce X X X X X X X X Residential X X X X X X X X Retail X X X X X X X X Parking X X X X X X X XCO-COMMITTED ASSET
The Hartford Building X X X X XMANAGED PORTFOLIO - SELECT-SERVICE ASSET MANAGEMENT CONTRACTS
Tysons Gateway X Richmond Station X Bella Collina X Momentum @ Shady Grove X Herndon X X X X X X X XEXISTING UNDER CONSTRUCTION
*Covered under the greater of the cost plus fee or market rate fee structure. 6 JUNE 2020 Comstock Leadership and Principal Owners of Anchor Portfolio
CHRIS CLEMENTE
Chairman & CEO of Comstock Holding Companies, Inc. Managing Director & Principal of Comstock Partners, LC, (Owner of Anchor Portfolio) 35 years industry experienceDWIGHT SCHAR
Chairman of NVR Owner of Washington Redskins, Principal of Comstock Partners, LC, (Owner of Anchor Portfolio) 50 years industry experience Chris Clemente founded the Comstock organization in 1985 and has guided its growth and diversifjcation since its inception. Mr. Clemente managed the growth of Comstock as a private enterprise until the 2004 initial public offering of Comstock Homebuilding Companies, Inc. (NASDAQ: CHCI), now known as Comstock Holding Companies, Inc. (“Comstock” or “Company”). Since the IPO, Mr. Clemente has served as Chairman of the Board and CEO of Comstock and is the largest individual stockholder of the Company. Mr. Clemente chairs Comstock’s Executive Committee, which charts strategic direction, evaluates acquisition opportunities, and oversees strategic partnerships, including multiple public-private partnerships where Comstock is the operating partner. Mr. Clemente co-owns Comstock Partners, LC with Dwight Schar and other family members, a family-owned, private company founded in 1999 to focus on commercial real estate development and Reshaped Management Team Combines Local Expertise with Institutional Asset Management Experience
TIMOTHY STEFFAN
EVP of Asset Management, Leasing & Development 35 years industry experienceMIKE DAUGARD
SVP of Acquisitions 21 years industry experienceSTEVE TRAUNER
Managing Director CRES 25 years industry experienceCHRISTOPHER GUTHRIE
CFO & EVP 19 years industry experienceRANDI KILLEN
SVP of Human Resources 18 years industry experienceSHARON FITZGERALD
Managing Director of Commercial Property Management 35 years industry experienceJUBAL THOMPSON
General Counsel & EVP 21 years industry experienceMICHAEL GUALTIERI
SVP of Finance & Corporate Controller 16 years industry experienceKRIS GREEN
VP of Residential Property Management 12 years industry experienceJOSEPH SQUERI
Director & EVP of Strategy and, Corporate Development 33 years industry experienceTRACY SCHAR
SVP of Marketing & Brand Management 31 years industry experienceDYLAN CLEMENTE
VP of Park X Management 5 years industry experience 8 JUNE 2020 Comstock History
2000 CP begins acquiring land for Reston Stn & Loudoun Stn | 2001 CP delivers 1st1985 − PRESENT
HB= Home Builder CP=Comstock Partners 9 JUNE 2020 Focusing on Select High-Growth Urban & Transitioning “Sub-Urban” Markets
TRANSIT-ORIENTED DEVELOPMENTS
Irreplaceable locations adjacent to key Metro stations on DC area’s new Silver Line, which is designed to accommodate over 5M passengers annually when Phase II is fully operational in 2021
STRONG SUBMARKET ECONOMIC FUNDAMENTALS
Thriving Northern Virginia fundamentals including YOY job growth at 4.4% in Q1-20 and among highest median household income in nation
RESILIENT ECONOMY
The Washington, DC MSA is diverse and resilient, demonstrating strong job growth in most years and ability to recover from market slowdowns faster than most
Since Transforming Operating Platform, Comstock Has Added More Than 4M SF of Assets Under Management
Q1 2018 CURRENT DIFFERENCE
COMMERCIAL 958,000 SF 3,250,000 SF 2,292,000 SF MULTIFAMILY 2,000,000 SF 3,200,000 SF 1,200,000 SF HOTELS 400,000 SF 400,000 SF RETAIL 314,000 SF 475,000 SF 161,000 SF TOTAL SF 3,272,000 SF 7,325,000 SF 4,050,000 SF Number of commercial assets 7 15 8 Number of multifamily assets 6 (1,400 units) 10 (2,800 units) 4 Number of hotel assets 0 (0 Keys) 2 (450 Keys) 2 TOTAL number of assets 13 27 14
Figures are approximate and include pipeline of development assets. 11 JUNE 2020 Increasing AUM Through Acquisition of Stabilized Assets and Development of Anchor Portfolio
1.0 2.0 3.0 4.0 5.0 6.0 7.0 2019 2020 2021 2022 2023 2024 2025 Operating Under construction / Development pipeline Sqft (millions) Additions from acquisitions
Figures and timing are approximate and include pipeline of development assets. 12 J UNE 20 Mixed-Use and Transit Oriented Reston Station Attracting Quality Tenants
17.8% 15.1% 10.2% 22.0%
OTHER
Based on net sq ft. Includes vacant spaces and expansion spaces at 1900 Reston Metro Plaza.5.8% 5.4% 4.8% 4.3%
etc.
3.6% 2.3% 2.3% 2.2% 2.1% 1.9%
13 JUNE 2020 Reston Station Represents the Beginning Transformation of Dulles Corridor
Reston Station is among the largest mixed-use, transit-oriented developments in the Washington D.C. MSA and led the market with more than 500,000 sf of
Located midway between Dulles Airport and Tysons Corner, the urban core of Reston Station surrounds the
Metro’s Wiehle Reston-East Station is situated at center
upwards of 25,000 daily commuters when Phase II of the Silver Line opens in late 2020 or early 2021 Spanning the Dulles Toll Road, the 40+ acre Reston Station neighborhood is being developed in four distinct districts:
RESTON STATION ASSETS OVERVIEW*
5M SF MIXED USE DEVELOPMENT 2M SF TROPHY-CLASS & CLASS-A OFFICE 210K SF RESTAURANTS, DESTINATION RETAIL 400+ KEYS FULL SERVICE & EXTENDED STAY HOTELS (2) 2,000+ RESIDENTIAL UNITS 7,500+ PARKING SPACES 500K+ SF LEASING ACTIVITY 2019
Reston Row District and West District in foreground and Commerce District in background. Commerce District in foreground. Metro Plaza and West District in background. *All numbers are approximate and residential totals include buildings by others. 14 JUNE 2020 Loudoun Station Is The First Transit-oriented, Mixed-use Development in Loudoun County
Loudoun Station, located at the terminus of Phase II of Metro’s Silver Line in Ashburn, VA is Loudoun County’s first Metro connected development. Currently the neighborhood is connected to Metrorail via non-stop commuter bus to Reston Station. Loudoun Station will be the terminus of the Silver Line upon completion. Phase II of Metro’s Silver Line is under construction and scheduled to commence passenger service in late 2020 or early 2021. More than 1 million SF of mixed-use development completed. Loudoun Station will be the terminus of the Silver Line Metro upon completion.*
Stabilized Operating Assets
PROJECT NAME LOCATION ASSET CLASS OFFICE GSF UNITS RETAIL SF
BLVD RESTON Reston Station Multifamily/Retail NA 448 8,700 FOUNDING FARMERS Reston Station Retail/Dining NA NA 12,500 1900 RESTON METRO PLAZA Reston Station Offjce/Retail 371,000 NA 8,500 1850 CENTENNIAL PARK Reston Station Offjce/Retail 107,000 NA 3,000 11400 COMMERCE PARK Reston Station Offjce/Retail 124,000 NA 12,400 11440 COMMERCE PARK Reston Station Offjce 162,000 NA NA 11480 COMMERCE PARK Reston Station Offjce 133,000 NA NA 1886 METRO CENTER DR Reston Station Offjce 90,000 NA NA BLVD LOUDOUN - PHASE I Loudoun Station Multifamily/Retail NA 357 62,000 43777 CENTRAL STATION Loudoun Station Offjce 52,000 NA NA AMC THEATRES Loudoun Station Retail NA NA 62,000 THE HARTFORD BUILDING Clarendon Offjce/Retail 196,000 NA 16,000 TOTAL 1,235,000 805 units ~1,000,000 SF 185,100 PARK X RESTON Reston Station Parking NA 1,687 spaces NA PARK X COMMERCE Reston Station Parking NA 1,629 spaces NA PARK X LOUDOUN Loudoun Station Parking NA 1,518 spaces 21,000 PARK X HARTFORD Clarendon Parking NA 520 spaces NA
Figures are approximate and include future development assets. 16 JUNE 2020 Active Development Pipeline
PROJECT NAME LOCATION SQUARE FEET TYPE ESTIMATED COMPLETION
1906 RESTON METRO PLAZA Reston Station 203K Offjce 2020 BLVD GRAMERCY EAST AND BLVD FLATS Loudoun Station 419K 318 units 2020 1902 RESTON METRO PLAZA Reston Station 225K Offjce 2021 HERNDON DOWNTOWN Herndon 339K 273 units 2023 ONE GRAMERCY Loudoun Station 175K Offjce 2023 ONE RESTON ROW Reston Station 315K Offjce 2023 BLVD GRAMERCY WEST Loudoun Station 304K 249 units 2023 MARRIOTT HOTEL AND CONDOS Reston Station 465K Hotel / 90 units 2023 ONE COMMERCE Reston Station 385K Offjce Build-to-suit BLVD RESTON ROW AND RETAIL Reston Station 355K 250 units 2023 TWO RESTON ROW Reston Station 222K Offjce 2024 BLVD WEST Reston Station 219K 200 units 2024 BLVD COMMERCE Reston Station 220K 200 units 2024 FUTURE PHASES 1.2M 500 units TOTAL 5M 1,990 units
Figures are approximate, include future development assets, and completion dates are subject to adjustments based on market conditions. 17 JUNE 2020 Northern VA Office Market
OFFICE MARKET SUPPLY/DEMAND FORECAST WASHINGTON METRO AREA (24 MONTHS ENDING SEPTEMBER 2021)
1 2 3 4 5 Northern Virginia Millions of Square Feet Suburban Maryland D.C. Demand Development Pipeline
48% Preleased 64% Preleased 38% PreleasedOPPORTUNITY: METRO-ADJACENT OUTPERFORMING OFFICE VACANCY RATE: NORTHERN VIRGINIA 3Q 2019
Vacancy Rate 8% 10% 12% 14% 16% 18% Within 1/4 mile radius
Class A in Reston and Tysons All Northern Virginia 20%
Source: Newmark Knight Frank.Next 24 Months Demand: 5.5 million SF New Supply: 7.5 million SF
18 JU NE Big Tech Focus on Northern Virginia Transforming Region into Silicon Valley of the East
The Silver Line consists of 23 miles of new track and 11 new commuter rail
second phase will open in late 2020 or early 2021. Phase I includes four stations in Tysons Corner and one station in the Dulles Corridor at Comstock’s Reston Station, which serves as terminus of Phase I of Silver Line. Phase II will extend the Silver Line from Reston Station to Dulles International Airport and into Loudoun County, adding six stations and terminating at Comstock’s Loudoun Station development. Commuter parking facilities are provided only at the Reston Station terminus
provided at the stations at Tysons Corner, Reston Town Center Station and Dulles Airport Station.
19 JUNE 2020 Reston Market
Reston is located in Fairfax County in Northern Virginia
in the Washington metropolitan area (#1 populous jurisdiction in the DC Metro region, #2 wealthiest county in the nation, 3.6% unemployment rate vs. 4.0% national average)
renovated buildings, and new walkable amenities, including Metro rail
Terminus of Phase I, and the largest commuter parking garage Reston Town Center commands a rent premium over older and less walkable micro-markets within Reston
rates of any micro-market in the Washington DC region Reston Station achieving comparable rents to Reston Town Center
from Reston Town Center and elsewhere
The Dulles Corridor is well positioned to outperform the broader market from a demand perspective with a fully funded defense budget and strong growth from big tech tenants specializing in cloud computing and cyber security
1900 Reston Metro Plaza Reston Town Center Reston Class A Loudoun Market
Loudoun County is located in the northeastern portion of Virginia and is less than 24 miles outside of Washington D.C. Loudoun County is the fastest growing and highest earning county in the U.S. with job growth of 68% since 2000 and a median household income of ~$125K, nearly triple that of the national average More than $3.5B has been invested in Loudoun County between July 2016 and April 2019, bringing the three-year total to more than $7.2 billion in commercial real estate investment Silver Line will add 7 Rail Stations in the Dulles Corridor with Loudoun Station representing the Terminus
Loudoun County benefits from its close proximity to the Dulles International Airport
serving more than 24M passengers annually with year-round fmights to over 125 destinations around the world
#1
Job Growth in the United States
2.5%
Unemployment Rate
#1
Wealthiest County in the Nation
36
YEARS
Median Age
Loudoun Station I and II with future phases of development and metro station in foreground. 21 JUNE 2020 Reconciliation of Non-GAAP financial measures (unaudited)
2019 2020 (in thousands) Full Year Q1 Total revenue 25,317 6,966 Total expenses 23,042 6,775 Operating income 2,275 191 Other income, net 225 9 Interest expense (474) (164) (Loss) gain on equity method investments carried at fair value (560) (47) (Loss) income before income tax expense 1,466 (11) Income tax expense (2) (1) Net (loss) income from continuing operations 1,464 (12) + interest expense 474 164 + Income tax expense 2 1 + D&A 301 89 + stock compensation 479 213 + Loss on equity method investments carried at fair value 560 47 EBITDA 3,280 502
Note: EBITDA is a non-GAAP fjnancial measure calculated as presented in the table above. CHCI considers EBITDA to be an appropriate supplemental measure of its operating performance, along with net income from continuing operations and operating income. The Company believes that EBITDA provides useful information to investors because by excluding the effects of certain amounts, such as interest, income tax expense, depreciation and amortization, stock compensation and loss on equity method investments carried at fair value, EBITDA may facilitate a comparison of current operating performance with historical comstockcompanies.com | 1886 Metro Center Dr, Reston, VA 20190 | 703. 230.1985
CHRISTOPHER GUTHRIE
Chief Financial Officer 703.230.1146