
SLIDE 1
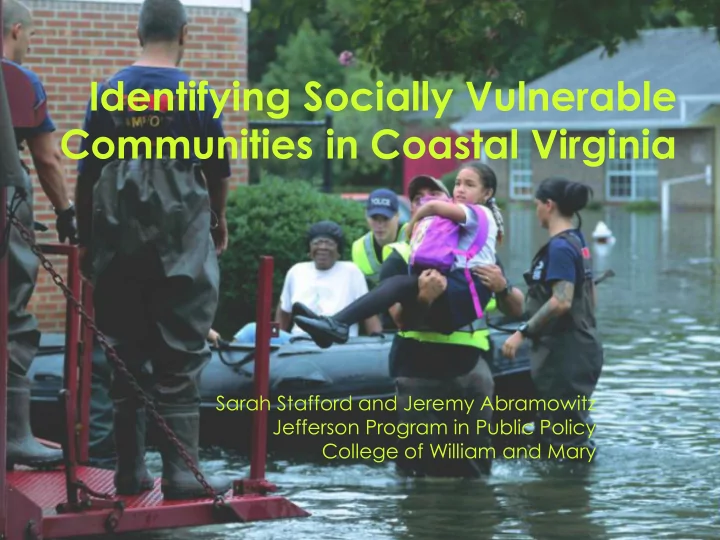
Identifying Socially Vulnerable Communities in Coastal Virginia
Sarah Stafford and Jeremy Abramowitz Jefferson Program in Public Policy College of William and Mary
Communities in Coastal Virginia Sarah Stafford and Jeremy Abramowitz - - PowerPoint PPT Presentation
Identifying Socially Vulnerable Communities in Coastal Virginia Sarah Stafford and Jeremy Abramowitz Jefferson Program in Public Policy College of William and Mary One option: Use data to identify areas with populations that are likely to
Sarah Stafford and Jeremy Abramowitz Jefferson Program in Public Policy College of William and Mary
One option: Use data to identify areas with populations that are likely to have a difficult time reacting to or recovering from a natural disaster.
Pros:
resources to conduct your
collection/assessment.
would otherwise “slip” through the cracks.
compliance with Environmental Justice requirements.
Pros:
resources to conduct your
collection/assessment.
would otherwise “slip” through the cracks.
compliance with Environmental Justice requirements. Cons:
data, which is collected for lots of other purposes, not specifically to identify socially vulnerable communities.
community individually or completely.
the process because the relationship between the different data elements and vulnerability is not always obvious or uni- directional.
Each set of census tracts has a different color. Tracts in red, orange and yellow are more vulnerable. Tracts in blue, purple and green are less.
Each set of census tracts has a different color. Tracts in red, orange and yellow are more vulnerable. Tracts in blue, purple and green are less.