
SLIDE 1
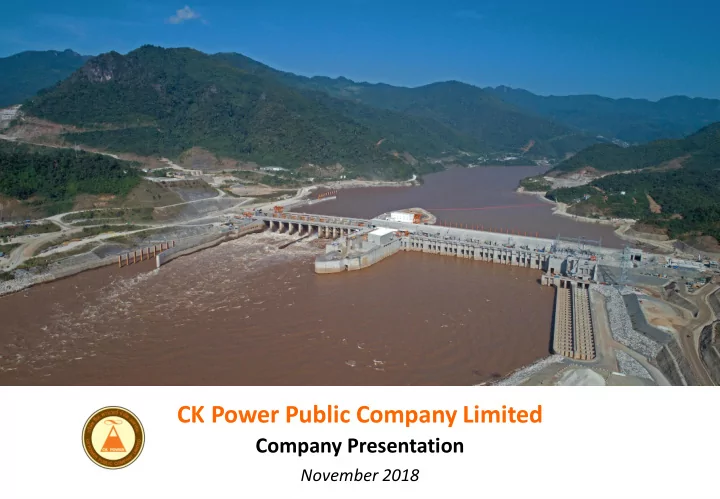
CK Power Public Company Limited Company Presentation November 2018 - - PowerPoint PPT Presentation
CK Power Public Company Limited Company Presentation November 2018 Disclaimer The information contained in this presentation is intended solely for your personal reference only. This presentation is not intended to provide the basis for any
The information contained in this presentation is intended solely for your personal reference only. This presentation is not intended to provide the basis for any investment decision, nor to substitute your own analysis and investigation, and should not be considered as a recommendation to any recipient of this presentation. Some statements made in this presentation are projections and forward- looking statements, with respect to CKP’s corporate plans, strategies and beliefs and other statements that are not historical facts and are subject to various risks and uncertainties. These statements can be identified by the use of forward-looking terminology such as “may”, “will”, “expect”, “anticipate”, “intend”, “estimate”, “continue”, “plan” or other similar words. The statements are based on the assumptions and beliefs of CKP’s management in light of the information currently available to CKP. These assumptions involve risks and uncertainties which may cause the actual results, performance or achievements to be materially different from any future results, performance or achievements expressed or implied by such forward-looking statements. Nothing in this presentation is, or should be relied on as a promise or representation of CKP as to the future.
2
3
(1) Shareholdingpercentageasof 29 June 2018; (2) Total paid-up shares = 7,370,000,000 shares
Hydro – 1,900 MW Cogeneration – 238 MW Solar – 22 MW
56% 75% 37.5% 65% 100% 30% 30%
615 MW 1,285 MW 8 MW 8 MW 6 MW
SouthEast Asia EnergyCompany Limited(SEAN) Nam Ngum 2 Power Company Limited (NN2) Xayaburi Power Company Limited (XPCL) Bangkhenchai Company Limited (BKC) Chiangrai Solar Company Limited (CRS) Nakorn Ratchasima Solar Company Limited (NRS) Bangpa-in Cogeneration Company Limited (BIC)
238 MW
Bangpa-in Cogeneration Phase 1 (BIC1) Bangpa-in Cogeneration Phase 2 (BIC2)
118 MW 120 MW Bangkok Expressway and Metro Public Company Limited (BEM) TTW Public Company Limited (TTW)
Company Limited (CK)
Public
27.41%(1) 19.34%(1) 25.31%(1) 27.94%(1) 29.98%(1) 19.40%(1) 19.29%(1)
4
CKP focuses on investing in power generation and distribution assets for CK Group, which currently holds 72% of CKP.
Under CK Power’s Umbrella Under CK Group’s Supervision
Since 2006, before the establishment of CKP in 2011, CK Group has already started developing multiple projects. These projects, along with platform of knowhow and expertise, were subsequently consolidated under CKP.
2006 2007 2008 2009 2010 2011 2012 2013 2014 2015 2016 2017 NN2 started construction NN2 IOD NN2 COD BIC1 started construction Group restructuring, transferring NN2, BIC, BKC, NRS, CRS under CKP NRS COD BKC COD XPCL started construction BIC1 COD CRS COD CKP listed
BIC2 started construction CKP acquired 30% in XPCL BIC2 COD 2018 2019 CKP’s BOD approved acquisition of 7.5% in XPCL XPCL SCOD CKP established
5 NN2’s Construction Period XPCL’s Construction Period BIC1 BIC2 BKC
6
CKP has diverse portfolio of 6 operating and 1 under-construction power plants with the majority of installed capacity concentrated in hydroelectric type of power generation.
NN2HPP Xayaburi HPP BIC 1 BIC 2 BKC CRS NRS
Operation Operation COD / SCOD CKP’s shares Capacity MW Equity MW
(1) CKP owns 56% in SEAN, which holds 75% in NN2HPP
NAM NGUM 2 HYDROELECTRIC POWER PROJECT (NN2HPP) XAYABURI HYDROELECTRIC POWER PROJECT (XAYABURI HPP)
Type : Hydroelectric Power Project (Storage Dam) IOD(1) : March 2011 COD(2) : January 2013 Concession Period : 25 years from COD with the GOL(3) Installed Capacity : 615 MW Power Purchase Agreement :
Power Generation :
Excess Energy
Shareholders :
75.0% 25.0% Shareholders of SEAN :
56.0% 33.0% 11.0%
(1) Initial Operation Date; (2) Commercial Operation Date; (3) Government of Lao PDR; (4) EdL Generation Public Company Limited; (5) Ratchaburi Electricity Generating Holding Public Company Limited
Type : Hydroelectric Power Project (Run-of-River) SCOD(6) : October 2019 Concession Period : 31 years from COD Annual Energy Production : 7,589 GWh Installed Capacity : 1,285 MW Power Purchase Agreement :
EGAT
Average Monthly Inflow : 3,890 cubic meters per second Maximum Operating Level : +275 m.asl. Shareholders :
37.5% 25.0% 20.0% 12.5% 5.0%
(6) Schedule Commercial Operation Date; (7) Electricity Generating Public Company Limited
7
BANGPA-IN COGENERATION POWER PROJECT PHASE 1 (BIC1) BANGPA-IN COGENERATION POWER PROJECT PHASE 2 (BIC2)
Type : Gas-fired Cogeneration COD : June 2013 BOI(1) Privilege : Tax Privilege Power Purchase Agreement :
with gas price pass-through mechanism)
industrial estate users Installed Capacity :
Shareholders :
65.0% 25.0% 10.0%
(1) The Board of Investment of Thailand; (2) Global Power Synergy Public Company Limited (3) Excluding approximately 4 MW of additional electricity capacity converted from steam production capacity
Type : Gas-fired Cogeneration COD : June 2017 BOI Privilege : Tax Privilege Power Purchase Agreement :
with gas price pass-through mechanism)
estate users Installed Capacity :
Shareholders :
65.0% 25.0% 10.0%
8
BANGKHENCHAI SOLAR (BKC) NAKORN RATCHASIMA SOLAR (NRS)
Type : Thin Film Solar Power Plant COD : August 2012 BOI(1) Privilege : Tax Privilege (8 years from January 2012) Power Purchase Agreement :
Installed Capacity : 8 MW Shareholders : CK Power 100.0%
(1) The Board of Investment of Thailand
Type : Thin Film Solar Power Plant COD : March 2012 Power Purchase Agreement :
Installed Capacity : 6 MW Shareholders :
30.0% 70.0% Type : Multi-crystalline Solar Power Plant COD : February 2013 Power Purchase Agreement :
Installed Capacity : 8 MW Shareholders :
30.0% 70.0%
CHIANG RAI SOLAR (CRS)
9
12% 88%
1. 2. 3. 4. 5. 6.
Nam Ngum 2 Hydroelectric Power Project (NN2HPP) Vientiane, Lao PDR Xayaburi Hydroelectric Power Project (Xayaburi HPP) Xayaburi, Lao PDR Bangpa-in Cogeneration Power Project (BIC1, BIC2) Ayutthaya, Thailand Bangkhenchai Solar Power Plant Nakhon Ratchasima, Thailand Nakhon Ratchasima Solar Power Plant Nakhon Ratchasima, Thailand Chiang Rai Solar Power Plant Chiang Rai, Thailand
Lao PDR Thailand 2 1 3 4 5 6
(1) Include under construction project 10
The majority of CKP’s current installed capacity is located in Lao PDR with the rest located in Thailand.
11
Hydro, 44% Cogen, 53% Solar, 2% Project Management, 1% Others, 0% Hydro, 51% Cogen, 44% Solar, 2% Project Management, 2% Others, 1%
Consolidated Financial Performance Unit: Bt mn Revenue Breakdown Key Highlights
5,631 7,027 6,809 6,359 6,930 5,033 6,786
REVENUE EBITDA(1) NPAT(1)
EBITDA Margin NPAT Margin +34.8% YoY +30.5% YoY +262.1% YoY
Unit: Bt mn
3,694 3,960 3,762 3,586 3,551 2,676 3,492 66% 56% 55% 56% 51% 53% 51% (1) 2016 EBITDA and NPAT excluded Bt 378 mn one-time write-off of Nam Bak Hydroelectric Power Project’s development cost. 12 219 472 412 214 159 132 478 4% 7% 6% 3% 2% 3% 7% 2013 2014 2015 2016 2017 9M17 9M18
9M18
9M17
+9.0% YoY
mainly driven by an increase of electricity sales from NN2 and BIC2.
contribution from NN2 and BIC2, and improvement in financial cost.
13
SCOD October 2019
88.12%
December 2017
September 2018
Total Revenue(1) Monthly Electricity Sales and Water Inflow Tariff Structure Electricity Sales Volume Unit: Bt mn Unit: GWh
Components 2013 2014 2015 2016 2017 9M17 9M18 PE 2,218 2,116 2,058 2,032 1,829 1,418 1,470 SE 92 7 41 71 25 25 90 EE 151 88
TE 9 4 6 7 4
94
2,469 2,326 2,199 2,109 1,857 1,443 1,904 +15.7% YoY
(1) SEAN’s Consolidated Financial Statements; (2) Long-term exchange rate assumption is 1 US$ = 34 Baht
Year PE Tariff SE Tariff EE Tariff US$/ kWh Bt/ kWh Total Bt equivalent(2)/ kWh Bt/ kWh Bt/ kWh 2011-2012
(IOD Period)
0.02475 0.963 1.805 1.253 1.060 2013-2018
(First 6 years from COD) 0.02475 0.965
1.807 1.255 1.062 2019 Onward 0.02668 1.041 1.948 1.353 1.145 4,115 3,976 3,883 3,815 3,318 2,587 2,992 55 17 20 18 9 7 8
4,170 3,993 3,903 3,833 3,328 2,594 3,001
2013 2014 2015 2016 2017 9M17 9M18
Revenue from Sales of Electricity Other Income
14
Hydro 44%
as a result of high water inflow during the 3rd quarter 2018.
800 1,600 2,400 3,200 4,000 100 200 300 400 500 Jan Feb Mar Apr May Jun Jul Aug Sep Oct Nov Dec
Electricity 2017 Electricity 2018 Estimated 2018 Inflow 2017 Inflow 2018
GWh MCM
Water level as at end of 3Q18 = +372.63 m.asl. Total Inflow for 10M18 = 10,003 MCM Total Inflow for 10M17 = 4,673 MCM
PE: 164 PE: 248 SE: 40 PE: 135
Total Revenue Monthly Electricity and Steam Production Electricity and Steam Sale Volume Unit: Bt mn Unit: GWh/Tons
+61.1% YoY 2013 2014 2015 2016 2017 9M17 9M18 EGAT 332 647 636 617 959 635 962 IUs 39 114 123 136 158 112 199 Total (GWh) 370 761 759 753 1,117 747 1,161 Steam (Tons)
24,454 94,329 97,312 97,503 104,645 78,996 71,806
price (Bt/MMBTU) 321 325 300 240 235 236 251 1,310 2,803 2,655 2,293 3,316 2,221 3,577 1 1 16 2 6 2 5
1,311 2,804 2,670 2,296 3,322 2,224 3,582
2013 2014 2015 2016 2017 9M17 9M18
Revenue from Sales of Electricity and Steam Other Income
15
Cogen 53%
2,000 4,000 6,000 8,000 10,000 12,000 20 40 60 80 100 120 140 160 Jan Feb Mar Apr May Jun Jul Aug Sep Oct Nov Dec Electricity 2017 Electricity 2018 Steam 2017 Steam 2018
GWh Tons
+44.7% YoY
electricity sales to new industrial customer since the 2nd quarter 2018.
Total Revenue Monthly Electricity Production Unit: Bt mn Electricity Sales Volume Unit: GWh
2013 2014 2015 2016 2017 9M17 9M18 PEA (GWh) 14.01 14.08 13.98 13.36 12.71 9.74 8.97
(Bt/kWh) 0.41 0.52 0.32 (0.33) (0.35) (0.36) (0.30) 160 163 158 148 140 107 100 1 2 2 1 1 1 3
161 164 160 149 141 108 103
2013 2014 2015 2016 2017 9M17 9M18
Revenue from Sales of Electricity Other Income
16
Solar 1%
0.0 0.2 0.4 0.6 0.8 1.0 1.2 1.4 Jan Feb Mar Apr May Jun Jul Aug Sep Oct Nov Dec Electricity 2017 Electricity 2018 GWh
weather condition, resulted in lower electricity production.
(1) D/E calculated from Total Liabilities divided by Total Shareholders’ Equity; (2) Loan outstanding before transaction costs; (3) Included long-term loan in US$ of 64 mn 17
Financial Position Leverage Ratios Long-term Loan(2) Unit: Bt mn Unit: Bt mn
6,500 16,358 3,284 3,842 302 CKP NN2 BIC1 BIC2 BKC
(3)
(1)
25,414 26,104 31,812 30,506 30,659 31,428 24,209 22,574 21,908 28,030 28,428 29,879 859 649 846 769 1,375 1,469
50,482 49,327 54,567 59,305 60,462 62,776
2013 2014 2015 2016 2017 3Q18
Total Equity IBD Other Liabilities
0.99x 0.89x 0.72x 0.94x 0.97x 1.00x 0.81x 0.72x 0.53x 0.67x 0.74x 0.79x 2013 2014 2015 2016 2017 3Q18
D/E Ratio Net IBD/E Ratio CKP’s Debentures Covenant: Net IBD/E not exceeding 3.00x
Cost of Debt
4.54% 4.53% 4.20% 4.13% 3.99% 3.97% 2Q17 3Q17 4Q17 1Q18 2Q18 3Q18 NN2 Bt 6 bn debentures issuance NN2 Bt 3 bn debentures issuance CKP Bt 6.5 bn debentures issuance
18
19
Our 2025 target of 5,000 MW installed capacity will be supported by investment opportunities across ASEAN regions, particularly those opportunities in Thailand, Lao PDR and Myanmar.
(1) COD in 2013; (2) COD in 2017; (3) COD in 2019
2012 2018 2025 875 2,166 5,000
2012 - 2014
615 MW
118 MW
120 MW
8 MW
8 MW
6 MW
2015-2017
120 MW
2018
Key Activities
from BEM
refinancing
solar projects
2020 - 2025
Key Focuses
projects in Lao PDR and Myanmar
projects in Thailand
2019
₋ Q1: 0.9 MW ₋ Q2: 3.2 MW ₋ Q3: 2.6 MW
Other Potential Projects
20