
SLIDE 1
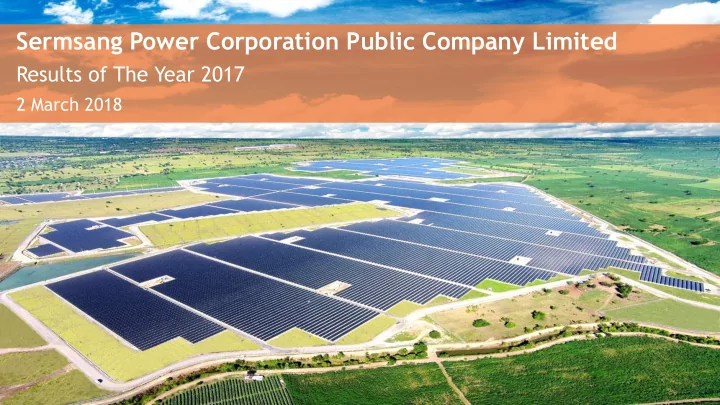
Sermsang Power Corporation Public Company Limited
Results of The Year 2017
2 March 2018
1
Sermsang Power Corporation Public Company Limited Results of The - - PowerPoint PPT Presentation
Sermsang Power Corporation Public Company Limited Results of The Year 2017 2 March 2018 1 Disclaimer The information contained in this presentation is strictly confidential and is provided by Sermsang Power Corporation Public Company Limited
Sermsang Power Corporation Public Company Limited
Results of The Year 2017
2 March 2018
1
Disclaimer
The information contained in this presentation is strictly confidential and is provided by Sermsang Power Corporation Public Company Limited (“SSP” or the "Company") to you solely for your information. Neither this presentation nor any part hereof may be (i) used or relied upon by any other party or for any other purpose; (ii) copied, photocopied, duplicated or
prior written consent of the Company and its respective affiliates or advisors. By attending this presentation, participants agree not to remove this document, or any materials provided in connection herewith, from the conference room where such documents are provided without express consent from the Company and its respective affiliates or advisors. Although care has been taken to ensure that the information in this presentation is accurate, and that the opinions expressed are fair and reasonable, no representations or warranties, express or implied, are made as to, and no reliance should be placed on, the accuracy, fairness or completeness of the information presented or contained in this presentation. The information is subject to change without notice, its accuracy is not guaranteed, has not been independently verified and it may not contain all material information concerning the Company and its subsidiaries. None of the Company nor any of its respective affiliates or advisors nor any of its or their respective members, directors, officers, employees or affiliates assumes any responsibility or liability for, the accuracy or completeness of, or any errors or omissions in, any information contained herein. Accordingly, none of the above nor any other person accepts any liability (in negligence, or otherwise) for any loss arising from or in connection with any use of this presentation or its contents. This presentation is for information purposes only and does not constitute or form part of any offer or invitation by or on behalf of the Company for sale or subscription of or solicitation
any contract, commitment or investment decision in relation thereto (“Securities”) in Thailand, the United States or any other jurisdiction. Any recipient considering a purchase of Securities is hereby reminded that any such purchase should be made solely on the basis of the information contained in a final offering document (which may be different from the information contained in this presentation ) and subject to the selling restrictions set out therein. No public offering of the Securities will be made in the United States or in any other jurisdiction outside of Thailand where such an offering is restricted or prohibited. This presentation should not be construed as legal, tax, investment or other advice. The information contained herein does not take into consideration the investment objectives, financial situation or particular needs of any particular investor, and should not be treated as giving investment advice. In addition, this presentation contains certain financial information and results of operation, and may also contain certain projections, plans, strategies, and objectives of the Company, that are not statements of historical fact which would be treated as forward looking statements that reflect the Company's current views with respect to future events and financial
as various risks which are in many cases beyond the control of the Company, and which may change over time and may cause actual events and the Company's future results to be materially different than expected or indicated by such statements. No assurance can be given that future events will occur, that projections will be achieved, or that the Company's assumptions are correct. Such forward‐looking statements are not guarantees of future performance and accordingly, the actual results, financial condition, performance or achievements
looking statements. In providing this presentation, the Company does not undertake to provide any recipient with access to any additional information or to update the information contained in this presentation or to correct any inaccuracies herein which may become apparent.
2
3
4 Key Message: first delivery on-time & on-budget; more to come during next 12 months
10-12 months.
Khunsight Kundi in Mongolia (16.4 MW).
secured capacity within next few years.
Hidaka Yamaga Zouen 2017 2018F 2019F 2020F Installed Capacity* (MW) + 38.4 MW + 87.0 MW 52.0 MW 90.4 MW 106.8 MW 193.8 MW Solar WVO
5
Leo Yamaga 2
Robust Portfolio Growth from High Quality Future Project Pipeline
Khonshigh + 16.4 MW Solar rooftop
Remark: Solar rooftop projects include SNNP1 (0.384 MW) ,SNNP2 (0.998 MW), and Do Home (3.00 MW).
Future Project Pipeline Details
6
Robust Portfolio Growth from High Quality Future Project Pipeline
Project Location Status Installed Capacity (MW) Expected COD
Hidaka Start Commercial Operation (1st March 2018) 21.0 Q1 2018 SNNP1 Complete 0.384 Q1 2018 SNNP2 Complete 0.998 Q1 2018 Do Home Under Construction 3.0 Q3 2018 Solar WVO Under Development 5.0 Q4 2018 Zouen Under Construction 8.0 Q4 2018 Khonshigh Kundi Under Construction 16.4 Q1 2019 Leo Under Development 40.0 Q2 2020 Yamaga Under Construction 34.5 Q2 2020 Yamaga 2 Under Development 12.5 Q2 2020
7
Project Hidaka 17.0 MW / 21.0 MW COD: 1st March 2018, FiT = 40 JPY/kwh Project Leo 30.0 MW / 40.0 MW SCOD: Q2/2020,FiT = 36 JPY/kwh Project Yamaga 30.0 MW / 34.5 MW SCOD: Q2/2020, FiT = 36 JPY/kwh
Location of JPN solar project
Total Installed Capacity of 116.0 MW
Project Yamaga2 10.0 MW / 12.5 MW SCOD: Q2/2020, FiT = 36 JPY/kwh Project Zouen 6.0 MW / 8.0 MW SCOD: Q4/2018, FiT = 36 JPY/kwh
9
Construction Progress: Hidaka
SSH
Project Yamaga Details
Business Type : Solar power plant Project Owner : GSSE (GK Company) Investment Type : Through SEG, as TK Investor, under GK-TK Investment Structure Investment Percentage : 90.0% Solar Irradiation* : 1,413 – 1,460 KWh/sq.m./annum Location : Kumamoto, Japan Installed/PPA MW : 34.5/30 MW Solar Cell Technology : Polycrystalline Silicon Land Details : 404-0-46 rais (surface right) Project Status : Under construction (commencement in July 2017) SCOD date : Approximately quarter 4, 2019 Total Project Cost : Approximately JPY 12,500.0 mm (THB 4,500.0 mm) Power Purchaser : Kyushu Electric Power Co., Inc Purchase Price : Under FiT Scheme of JPY 36/KWh Purchase Term : 20 years Tax Incentive : GK-TK Structure
deductible expense at GK Company level
*Source: (i) New Energy and Industrial Technology Development Organization (ii) Power Plant Analysis Report, Mitsui Chemicals Inc.
10
Project Details: Yamaga
GSSE
Yamaga 1&2: Overall Layout
11
GSSE
12
Construction Progress: Yamaga
GSSE
Construction Progress (Yamaga)
GSSE 0.00% 10.00% 20.00% 30.00% 40.00% 50.00% 60.00% 70.00% 80.00% 90.00% 100.00%
Yamaga C Project S-curve
Plan Actual
Approval and Permit Counterparty Status
METI Approval Ministry of Economy, Trade and Industry (METI) and ZOUEN Secured Grid Connection Approval Kyushu Electric Power Co., Inc and ZOUEN Secured Construction and Land Development Permits Ministry of Agriculture Forestry and Fisheries and ZOUEN Secured
Agreement Counterparty Status
Power Purchase Agreement Kyushu Electric Power Co., Inc and ZOUEN On Process TK Agreement SEG and ZOUEN Engaged Asset Management Agreement TBD On Process Surface Right Reservation Agreement KK Nippon Varie and ZOUEN Engaged EPC Agreement TBD On Process O&M Agreement TBD On Process Credit Facilities Agreement TBD On Process
Project Details: Zouen
Project Zouen Details
Business Type : Solar power plant Project Owner : ZOUEN (GK Company) Investment Type : Through SEG, as TK Investor, under GK-TK Investment Structure Investment Percentage : 100.0% Solar Irradiation* : 1,512 KWh/sq.m./annum Location : Kumamoto, Japan Installed/PPA MW : 8/6 MW
*Source: (i) New Energy and Industrial Technology Development Organization (ii) Power Plant Analysis Report, Mitsui Chemicals Inc.
Solar Cell Technology : Polycrystalline Silicon Land Details : Approximately 77-2-27 rais (surface right) Project Status : Under construction (commencement in Sep 2017) SCOD date : Approximately quarter 4, 2018 Total Project Cost : Approximately JPY 3,000.0 mm Power Purchaser : Kyushu Electric Power Co., Inc Purchase Price : Under FiT Scheme of JPY 36/KWh Purchase Term : 20 years
14
Zouen
Zouen: Overall Layout
15 Red shading represents installed panels
Zouen
16
Construction Progress: Zouen
Zouen
17
Construction Progress (Zouen)
0.00% 10.00% 20.00% 30.00% 40.00% 50.00% 60.00% 70.00% 80.00% 90.00% 100.00%
Zouen Project S-curve
Plan Actual Zouen
18
Other Projects under Development
Ratchsrima, Khon Kaen, and Chiang Mai))
19
SNNP 1: Details and Progress
Photo: As of December 2017
20
SNNP 2: Details and Progress
Photo: As of December 2017
21
Do Home: Details and Progress
Project Details
Business Type : Solar power plant Project Owner : Tenuun Gerel Construction LLC Shareholding Stake : 75% Solar Irradiation* : 1,776.9 KWh/sq.m./annum Location : Khushigt, Tuv, Mongolia (South of Ulaanbaatar) Installed/PPA MW : 16.4/15 MW SCOD date : Within 1st quarter 2019 Power Purchaser : National Dispatching Center LLC Purchase Price : Under FiT Scheme of USD 0.162/KWh
*Source: (i) Meteonorm Software
Khunshight Kundi Project in Mongolia
22
Khunshight Kundi Project in Mongolia
23
Security watch house (Ger) South New airport
24
25 Key Message: solid core profit with dividend yield during growth delivery
which approx. 26 MTHB is land lease during construction)
profit.
beyond committed pipelines.
1 Based on closing price @28/2/18
26
Full-year volume is slightly higher with relatively stabilized tariff environment
SPN YTD QoQ YoY Production 0.74%
Average Tariff
0.64% Ft rate adjustment (satang/kWh) Jan’16 – Apr’16 (0.1590) Change : May’16 – Aug’16 (0.3966) Change : (0.24) Sep’16 – Dec’16 (0.4284) Change : (0.03) Jan’17 – Apr’17 (0.4716) Change : (0.04) May’17 – Aug’17 (0.3477) Change : 0.12 Sep' 17 – Dec’17 (0.3015) Change : 0.05
Revenue and gross profit reflect solid performance of SPN
Consolidation
27
volume despite lower tariff
tariff
tariff. Note 1) Percentage change of sale revenue
tariff
Revenue
Sales Revenue Other Revenue
COGS
O&M Costs Depreciation and Amortization Others
Gross Profit
(Unit: ‘000 THB) (Unit: ‘000 THB) (Unit: ‘000 THB)
SG&A reflects our expansion activities before contribution from investment pipelines
Consolidation
28
unrealized FX loss for 4Q16 = 47.6; and for 12M16 =19.0 MTHB)
Note 1) Percentage change of general expenses
decreasing is mainly as a result of higher SG&A, despite higher gross profit.
SG&A Adjusted Operating Profit
General Expenses Land lease During Construction Unrealized FX loss
(Unit: ‘000 THB) (Unit: ‘000 THB) (Unit: ‘000 THB)
1 1 1
29
AOP, as our core profit and basis for 2017 dividend, is within the expected range, before contribution of expansion pipeline.
30
Summary
Consolidation
12M17 vs 12M16
general SG&A expenses
YoY (4Q17 vs 4Q16) and QoQ (4Q17 vs 3Q17)
lower QoQ.
704,093 700,141 681,945 731,860 339,832 448,642 472,113 487,242 12M17 12M16
Gross Profit EBITDA (excl unrealized FX) Net Profit (to SPP's shareholders) Adjusted Operating Profit kTHB
163,510 176,038 167,099 149,896 173,321 171,712 72,808 54,104 62,711 112,484 114,172 119,354
4Q17 3Q17 4Q16
Gross Profit EBITDA (excl unrealized FX) Net Profit (to SPP's shareholders) Adjusted Operating Profit kTHB
QoQ YoY 12M
Gross Profit
0.6%
EBITDA (excl unrealized FX)
Net Profit (to SPP's shareholders)
34.6% 16.1%
Adjusted Operating Profit
Consolidated P&L
Consolidation
31
which is mainly from lower volume, despite higher average tariff, and lower QoQ (compared to 3Q17), which is mainly from lower volume and average tariff.
higher an import tax in 12M16
9M16 as gain) while 12M17 is 72.8 MTHB loss.
whereas 12M17 is +31% from 12M16.
shareholders) adjusted by
injection of equity into constructing projects
related to IPO expenses (which is mostly deducted from amount of IPO proceeds and booked as equity)
P&L Statement ('000 THB) 4Q17 3Q17 4Q16 12M17 12M16
Sale Revenue 205,657 218,170 209,166 871,702 869,172 Unrealized FX gain
3,297 502 4,439 5,408 7,539 Total Revenue 208,954 218,672 213,606 877,110 876,711 Cost of Goods Sold 42,147 42,132 42,067 167,609 169,031 Gross Profit (Sale rev. - COGS) 163,510 176,038 167,099 704,093 700,141 Gross Profit Margin 79.51% 80.69% 79.89% 80.8% 80.6% SG&A 71,049 71,352 77,481 219,901 114,183 Land lease during construction 17,270 4,107 4,985 31,516 7,061 Unrealized FX loss 23,996 37,998 47,618 72,795 18,972 General G&A expenses 29,783 29,247 24,879 115,589 88,150 EBITDA (excluding unrealized FX gain/loss) 149,896 173,321 171,712 681,945 731,860 EBITDA margin 71.74% 79.26% 80.39% 77.75% 83.48% Financial Expenses 25,680 43,846 34,385 146,880 146,114 Tax 130 8,018 (2,146) 8,115 (6) Net Profit 69,948.85 53,324.00 61,817.23 334,606 447,388 Net Profit Distribution To SSP's Shareholders 72,808 54,104 62,711 339,832.16 448,642.23 Minority Shareholders of Subsidies (2,859) (780) (894) (5,226) (1,254) Adjustment Items (after minority interest) Unrealized FX (gain)/loss 23,996 37,998 47,618 72,795 18,972 Uncapitalized land lease during construction 15,658 3,569 4,332 26,557 6,136 Uncapitalized interest for SSP's equity loan
4,705 24,952 13,541 Deferred tax expenses 22 8,019 (12) 7,976 (49) Adjusted Operating Profit (to SSP's shareholders) 112,484 114,172 119,354 472,113 487,242
32
Consolidated Balance Sheet
Consolidation
yearend dividend of 2016 and 80 MTHB as interim dividend) and 125 MTHB (interim dividend) in Aug-17, and 115 MTHB (interim dividend) in Nov-17 and expected to pay approximately 105 MTHB in Mar-18 (under process with lenders). (Note: reference for subsequent agenda in acknowledging SPN dividend payment)
development.
proceeds from IPO since the end of 3Q/17, more loan was drawn for Japanese solar farm under construction. Hence. total long-term loan increased.
4Q17.
Balance Sheet Statement ('000 THB) 30-Dec-17 30-Sep-17 31-Dec-16
Cash and Cash Equivalent 1,603,392 1,507,435 367,356 Account Receivables 151,364 159,099 152,289 Other Current Assets 45,730 176,870 65,974 Total Current Assets 1,800,486 1,843,404 585,619 Receivables from Revenue Department 246,378 228,127 155,781 PP&E 5,427,213 4,803,498 3,684,953 Intangible Assets 654,207 676,172 535,997 Other Fixed Assets 141,559 147,322 293 Total Fixed Assets 6,469,357 5,855,119 4,377,024 Total Assets 8,269,843 7,698,523 4,962,643 Account Payables 256,696 75,435 32,959 Current Portion of Long-Term loan 510,313 492,138 362,414 Other Current Liabilities 15,517 17,682 15,913 Total Current Liabilities 782,526 585,255 411,286 Long-Term Loan 4,061,676 3,797,588 3,250,790 Other Non-Current Liabilities 3,973 4,092 3,758 Total Non-Current Liabilities 4,065,649 3,801,680 3,254,548 Total Liabilities 4,848,175 4,386,935 3,665,834 Paid-up capital 922,000 922,000 690,875 Premium on ordinary shares 1,511,210 1,511,210
40,714 24,719
814,991 758,177 515,872 Others 18,916 28,807 34,872 Total Equity of Company 3,307,830 3,244,913 1,241,619 Minority interest 113,839 66,675 55,190 Total Equity 3,421,669 3,311,588 1,296,809
33
34
35
Availability and Performance Ratio
SPN
36
Group Structure
Project Sermsang Solar (52/40 MW*)
Holding Company TK Investor Related Business Generation and Sales of Electricity GK Company Type of Business
SSP SPN EP PE PTG PPP SCS SRP SS SSC SN SI AE ZOUEN SGP ACM
100.0% 100.0% 100.0% 100.0% 100.0% 100.0% 100.0% 100.0% 100.0% 100.0% 100.0% 100.0% 100.0% 100.0% 100.0% 86.9% ~90.0% Project Hidaka (21/17 MW*) Project Yamaga (34.5/30 MW*) Project SNNP 1 - 2 (1.4 MW) Thailand Hong Kong Japan
Remark: * Installed/Contracted Capacity
SEG SJC
100.0% Project Zouen (8/6 MW*) ~100.0%
GSSE SSH
Project Solar WVO (5/5 MW*)
Shell Company for Future Project
Project Leo (ASP1&ASP2) (40/30 MW*) ~100.0%
ASP1 ASP2
36
Agreement Counterparty Status
Contract Agreement Sermsang Solar and WVO Engaged Power Purchase Agreement Provincial Electricity Authority (PEA) On Process EPC Agreement TBD On Process Credit Facility Agreement TBD On Process O&M Agreement TBD On Process
Project Details: WVO Project
*Source: Meteonorm Software
Solar Cell Technology : Polycrystalline Silicon Land Details : Approximately 51 Rais (Power Plant Area) Project Status : EPC is finalizing SCOD date : December 31, 2018 Total Project Cost : Approximately 188.16 Million THB Power Purchaser : Provincial Electricity Authority (PEA) Purchase Price : Under FiT Scheme of THB 4.12/KWh Purchase Term : 25 years
37
Construction Start Date: Scheduled on March 2018 Approval and Permit Counterparty Status
Ror-ngor 4 Energy Regulatory Commission (ERC) On Process Aor 1 On Process BOI Office Of The Board Of Investment On Process License of Power Generation Controlled (Por-Kor 2) Energy Regulatory Commission (ERC) On Process License of Power Generation On Process Land Use Permit WVO Secured
Project WVO Details
Business Type : Solar power plant Project Owner : Sermsang Solar Investment Percentage : 100 Solar Irradiation* : Approximately 1854.4 KWh/sq.m./annum Location : Ratchaburi province Installed/PPA MW : 5 MW
5 MW WVO Project
SSH
38