Chapter 5: DATA PRESENTATION OF THE BUSINESS SECTORS - - PDF document

chapter 5 data presentation of the business sector s
SMART_READER_LITE
LIVE PREVIEW

Chapter 5: DATA PRESENTATION OF THE BUSINESS SECTORS - - PDF document

Chapter 5: DATA PRESENTATION OF THE BUSINESS SECTORS CONTEXTUAL NEED FOR MBA SERVICE-LEARNING The problem statement with its attendant sub-problems and the resultant hypothesis or proposition are restated in each of Chapters 5, 6, and 7


slide-1
SLIDE 1

113

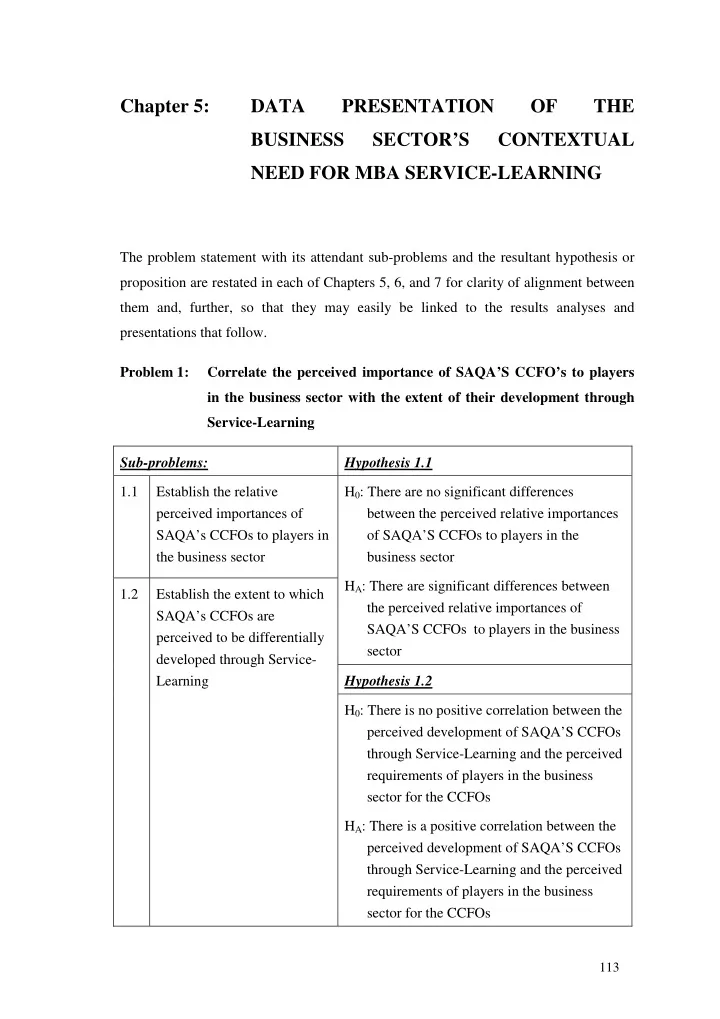
Chapter 5: DATA PRESENTATION OF THE BUSINESS SECTOR’S CONTEXTUAL NEED FOR MBA SERVICE-LEARNING

The problem statement with its attendant sub-problems and the resultant hypothesis or proposition are restated in each of Chapters 5, 6, and 7 for clarity of alignment between them and, further, so that they may easily be linked to the results analyses and presentations that follow. Problem 1: Correlate the perceived importance of SAQA’S CCFO’s to players in the business sector with the extent of their development through Service-Learning Sub-problems: Hypothesis 1.1 1.1 Establish the relative perceived importances of SAQA’s CCFOs to players in the business sector H0: There are no significant differences between the perceived relative importances

  • f SAQA’S CCFOs to players in the

business sector HA: There are significant differences between the perceived relative importances of SAQA’S CCFOs to players in the business sector Hypothesis 1.2 1.2 Establish the extent to which SAQA’s CCFOs are perceived to be differentially developed through Service- Learning H0: There is no positive correlation between the perceived development of SAQA’S CCFOs through Service-Learning and the perceived requirements of players in the business sector for the CCFOs HA: There is a positive correlation between the perceived development of SAQA’S CCFOs through Service-Learning and the perceived requirements of players in the business sector for the CCFOs

slide-2
SLIDE 2

114

5.1 Hypothesis 1.1

H0: There are no significant differences between the relative importances of SAQA’s CCFOs to players in the business sector; HA: There are significant differences between the perceived relative importances of SAQA’s CCFOs to players in the business sector. Data have been drawn from a number of different sources to establish not only the importance of the CCFOs to players in the business sector, but also their importance relative to one another. These data are presented separately, then meta-analysed to establish a conclusion against which CCFO development is charted for the purposes of establishing the correlation between them, as per Hypotheses 1. 5.1.1 Results of the meta-inquiry The summary profile of the ten business executives who participated in the meta- inquiry can be seen in Table 5.1 Table 5.1 Summary profile of the business leaders participating in the meta- inquiry

Seniority of respondents # Partners # CEO # Directors # Senior managers 1 2 5 2 Company size > 10000 2001 - 10000 501 – 2000 < 500 1 3 1 5 Annual turnover in South Africa > R50 million 10-20m <R2m 7 1 2

slide-3
SLIDE 3

115

After initial discussions to establish whether the CCFOs did indeed have business relevance, the executives were requested to indicate the relative importance (weights on a 100-point constant sum scale) of each of the CCFOs to the success of their business. Based on the preliminary discussions, it became clear that not only were the seven assessable CCFOs important, but that outcomes of the five educational aim CCFOs should be evaluated. For this reason, all 12 of the CCFOs were listed as outcomes in the meta-inquiry. A further change was that “making decisions” and “problem solving” were separated from being in the same CCFO into two separate entities, the respondents feeling that they were sufficiently different from one another to do so. The findings of this enquiry are in Figure 5.1. The striped bars indicate the seven legislated CCFOs. Figure 5.1 Meta-inquiry findings of the relative importances of the CCFOs

201 128 118 101 93 74 74 68 36 29 28 27 23 50 100 150 200 250 Solving Problems Working with others Making decisions Entrepreneurial thinking Communicating Managing oneself Managing information Systems thinking Cultural sensitivity Learning to learn Using technology Exploring alternatives Citizenship CCFOs plus additional recommended items Total relative weight (importance)

slide-4
SLIDE 4

116

Since it was the intention to focus only on the seven assessable CCFOs, being those legislated, most of the other evaluations of their importances conducted in this study have been carried out only on the SAQA seven, but in some cases the entire range as demonstrated in Figure 5.1 has been included. The (abbreviated as as shown in Figure 5.1) seven assessable CCFOs are listed below:

  • Solving problems
  • Managing information
  • Working with others
  • Systems thinking
  • Communicating
  • Managing oneself
  • Using technology

5.1.2 Re-analysis of CCFO importances data In this analysis, only the seven assessable CCFOs were analysed to determine their comparative importances, since these seven are those legislated for learner assessment. The limitation has face validity and still provides a valuable contribution to the assessment of the importances of the CCFOs, given that it was never the intention of this research to include validation of the CCFOs. The expanded data set (n = 142) comprising the importances findings from Carmichael and Sutherland (2005) combined with the unpublished data set obtained from the SEP programmes were found to be not normally distributed, so were analysed using the Kruskal-Wallis one-way ANOVA on ranks test (Appendix 9). Results were also

  • btained from the Scheffe’s multiple comparison test, which carries out pair-wise

comparisons between means, as well as the more rigorous Tukey-Kramer multiple comparisons test, which tests for all differences between both pairs and groups. The

slide-5
SLIDE 5

117

relative mean overall importances of the seven assessable CCFOs are demonstrated in Figure 5.2. Figure 5.2 % mean weights of the relative importances of the seven assessable CCFOs (n=142) The significance of the differences between the importances of the CCFOs are shown in Table 5.2, and in greater detail in Appendix 9. The Kruskal-Wallis test clearly demonstrates that there is a significant (alpha = 0.05) difference between at least two of the medians.

2 4 6 8 10 12 14 16 18 20

Percentage

CCFO 19.27 16.34 16.26 14.77 12.65 11.97 8.74 Solve Problems Info mgmt Work w

  • thers

Systems thinking Communicati

  • n

Self mgmt Use Technol

slide-6
SLIDE 6

118

Table 5.2 Results of the Kruskal-Wallis One-way ANOVA on ranks

Kruskal-Wallis One-Way ANOVA on Ranks Hypotheses Ho: All medians are equal. Ha: At least two medians are different. Test Results Chi-Square Prob Method DF (H) Level Decision(0.05) Not Corrected for Ties 6 203.2601 0.000000 Reject Ho Corrected for Ties 6 212.2278 0.000000 Reject Ho Number Sets of Ties 28 Multiplicity Factor 4.149914E+07 Group Detail Sum of Mean Count Ranks Rank Z-Value Median Solve problems 142 97232.00 684.73 8.3943 20 Systems thinking 142 71443.00 503.12 0.2520 14.5 Work with others 142 82857.50 583.50 3.8558 15 Communication 142 61884.00 435.80

  • 2.7661

10 Info mgmt 142 84756.00 596.87 4.4553 15 Self mgmt 142 59038.50 415.76

  • 3.6645

10 Use technology 142 37304.00 262.70

  • 10.5267

10

The results from the Tukey-Kramer multiple comparisons test have been presented in tabular format to illustrate which CCFOs are significantly different (alpha = 0.05) from which others. Because it is the most rigorous of the comparative tests, it is the only one to be presented here, although the results from the others may be seen in Appendix 9. The blue shaded blocks show a significant (alpha = 0.05) difference in the perceived importance between the two CCFOs indicated in the matrix. Each CCFO is significantly different in perceived importance from at least one other. The CCFO “use technology” is the only assessable CCFO found to be significantly different in importance to all the

  • thers.
slide-7
SLIDE 7

119

Table 5.3 Results of the Tukey-Kramer multiple comparisons test

CCFO Solve probl Work w

  • thers

Self mgmt Info mgmt Commu nication Use technol Systems thinking Solve problems Work w

  • thers

Self mgmt Info mgmt Communica tion Use technology Systems thinking

The findings presented above demonstrate that Null Hypothesis 1.1 may be rejected, and that the perceived relative importances of the CCFOs to the business sector are significantly different (alpha = 0.05) from one another.

5.2 Hypothesis 1.2

H0: There is no positive correlation between the perceived development of SAQA’S CCFOs through Service-Learning and the perceived requirements

  • f players in the business sector for the CCFOs

HA: There is a positive correlation between the perceived development of SAQA’S CCFOs through Service-Learning and the perceived requirements

  • f players in the business sector for the CCFOs

The development of the CCFOs through Service-Learning was evaluated both perceptually and through assessment of student assignments. The perceptions were

slide-8
SLIDE 8

120

those of selected Service-Learning practitioners, and actual assessment was through the application of Bloom’s taxonomy of learning outcomes to student assignments; a level

  • f cognitive development for each CCFO was allocated.

5.2.1 Perceptions of CCFO development through data re-analysis As in section 5.1.2, the dataset (n = 142) comprising the CCFO development findings from Carmichael and Sutherland (2005) combined with the unpublished dataset

  • btained from the SEP programmes were utilised for analysis. Although this dataset was

drawn from respondents not having been exposed to Service-Learning as pedagogy, they were exposed to other documented (Carmichael and Sutherland 2005) teaching

  • methodologies. Comparing the findings from the expanded dataset used in this study to

the findings from the survey of Service-Learning practitioners suggests that a judgement may be made about whether Service-Learning is at least as good as other methodologies when teaching MBA students. Table 5.4 illustrates. Table 5.4 The NDFA rescaled means and probabilities (alpha = 0.05) of management students’ perceptions of their development of the assessable CCFOs

Rescaled mean Standard deviation p-value Systems thinking 0.50 0.94 0.0000 Solve problems 0.44 0.85 0.0000 Info management 0.30 0.95 0.0003 Work with others

  • 0.02

0.87 0.7474 Communication

  • 0.22

0.81 0.0021 Self management

  • 0.34

0.95 0.0000 Use technology

  • 0.65

1.03 0.0000

The yellow coloured rows indicate a positive significant difference (alpha = 0.05) and the green coloured rows indicate a negative significant difference (alpha = 0.05) in terms of development of each CCFO. The rescaled development data were then plotted against the importances data as illustrated in Figure 5.3.

slide-9
SLIDE 9

121

Figure 5.3 A plot of the assessable CCFOs: perceived importances vs their perceived development (expanded dataset, n = 142) The value of R (the correlation co-efficient) and R2 (the co-efficient of determination) (Allan 1982) as shown on the chart demonstrates that 74% of the variation on the y axis can be explained by the variation on the x axis. Conducting this analysis provides a benchmark against which the perceived development of the CCFOs by Service- Learning practitioners, in the next section, can be compared. 5.2.2 Perceptions of CCFO development by Service-Learning practitioners To satisfy both the recommendations of the meta-inquiry and those of the legislation, all 13 CCFO variables (as per Figure 5.1) were analysed and then the seven assessable CCFOs were analysed separately. The first analysis was conducted to establish the

CCFO (combined) weights vs development recalculated with NDFA

R

2 = 0.7429

R = 0.8619 0.00 5.00 10.00 15.00 20.00 25.00

  • 0.80
  • 0.60
  • 0.40
  • 0.20

0.00 0.20 0.40 0.60 Relative development (NDFA rescaled) Mean weight (relative importance)

Solve problems Systems thinking Manage information Work w others Communication Self management Use technology

slide-10
SLIDE 10

122

extent of development of the full range of CCFO variables perceived to be important in the business sector; the second was carried out because of its higher validity, and for charting against the perceived importances of the same seven assessable CCFOs. Stacey’s (2005) Normal Distribution Fitting Algorithm was applied to the Likert scale data obtained from the respondents to rescale it from ordinal data to interval data. The summarised rescaled means and probability values (alpha = 0.05) are illustrated in Tables 5.5 and 5.6. Table 5.5 The NDFA rescaled means and probabilities (alpha=0.05) of Service- Learning practitioners’ perceptions of the 13 CCFO’s development

Rescaled mean Standard deviation p-value Work with others 0.8336 0.8731 0.0000 Solving problems 0.4753 0.7800 0.0016 Self management 0.4592 0.6926 0.0009 Communication 0.2535 1.0116 0.1660 Information management 0.1725 0.9210 0.2974 Cultural sensitivity 0.1445 0.6328 0.2206 Learning to learn 0.0952 0.7905 0.5146 Making decisions

  • 0.0416

0.8762 0.7900 Systems thinking

  • 0.0640

0.7605 0.6372 Citizenship

  • 0.2884

1.2625 0.2369 Explore opportunities

  • 0.5115

0.8143 0.0021 Entrepreneurial thinking

  • 0.6686

1.0026 0.0022 Using technology

  • 0.8596

0.9231 0.0000

As shown previously the probabilities at alpha = 0.05, are presented so that the yellow coloured rows indicate a positive significant difference and the green rows a negative significant difference in terms of the perceived development of the CCFOs by the Service-Learning practitioners. Table 5.5 relates to all 13 CCFO variables identified in the meta-inquiry, and Table 5.6 to the seven assessable CCFOs only, since these were the main focus of the competence requirements in the business sector.

slide-11
SLIDE 11

123

Table 5.6 The NDFA rescaled means and probabilities (alpha = 0.05) of Service- Learning practitioners’ perceptions of the 7 assessable CCFOs development

Rescaled mean Standard deviation p-value Work with others 0.7770 0.7541 0.0000 Solving problems 0.4686 0.6740 0.0004 Self management 0.4558 0.5994 0.0002 Communication 0.2918 0.8781 0.0693 Information management 0.2112 0.7940 0.1422 Systems thinking 0.0107 0.6542 0.9268 Using technology

  • 0.7577

0.9798 0.0001

5.2.3 The correlation between the perceived importances and the perceived development of the CCFOs through Service-Learning As stated in Hypothesis 1.2, the correlation between the importances of the CCFOs to the business sector and the development of the CCFOs through Service-Learning needs to be determined. The plot of these findings may be seen in Figure 5.4, and it should be noted that the correlation coefficient is 0.68 and the coefficient of determination (r2) is

  • nly 47.26%, although it is a positive correlation.
slide-12
SLIDE 12

124

Figure 5.4 A plot of the seven assessable CCFOs: perceived importances (n = 142) vs their perceived development through Service-Learning (n = 32) The correlation is positive, although weaker than that seen with the larger sample, but it does need to be noted that the Service-Learning practitioner sample was small (n=32). Thus for Hypothesis 1.2 the null hypothesis is rejected. There was found to be a positive correlation between the perceived development of SAQA’S CCFOs through Service-Learning and the perceived requirements of players in the business sector for the CCFOs CCFO weights (combined) vs S-L Development

R

2 = 0.4726

R = 0.6875 0.00 5.00 10.00 15.00 20.00 25.00

  • 1.00
  • 0.80
  • 0.60
  • 0.40
  • 0.20

0.00 0.20 0.40 0.60 0.80 1.00 Relative development (NDFA rescaled) M ean weight (relative importance)

Solve problems Work w others Self management Manage information Systems thinking Communication Use technology