SLIDE 1 Chapter 2: Designing a Pedometer and Calorie Counter
Introduction
Pedometers, now popular as an everyday exercise progress monitor and motivator. The increasing popularity of these devices can be attributed to several reasons. First, many people are known to
- verestimate their level of activity, hence these devices can provide more reliable feedback to an
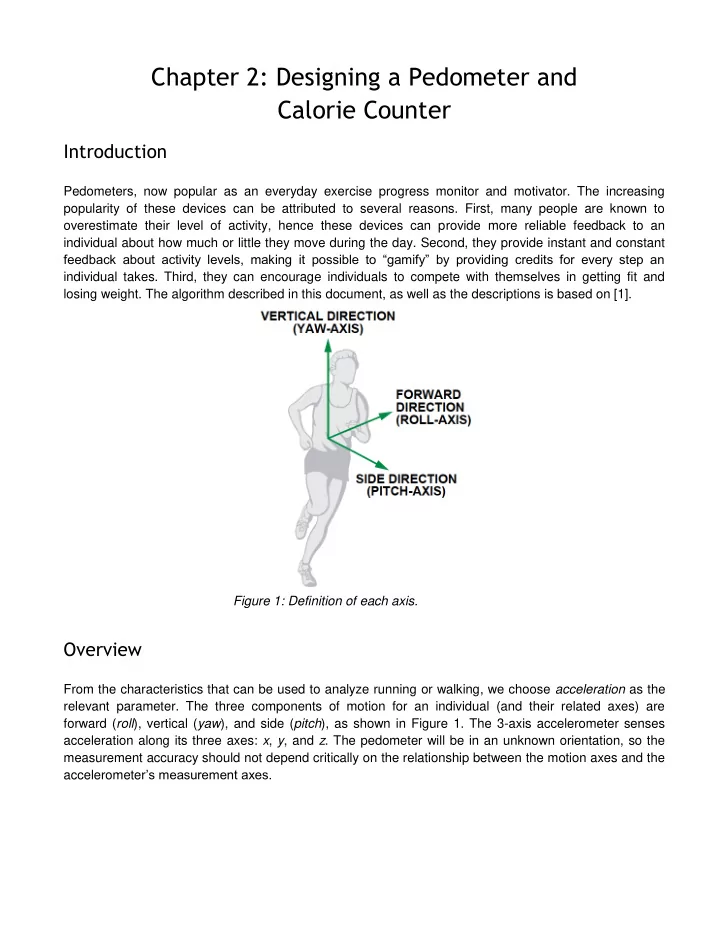
individual about how much or little they move during the day. Second, they provide instant and constant feedback about activity levels, making it possible to “gamify” by providing credits for every step an individual takes. Third, they can encourage individuals to compete with themselves in getting fit and losing weight. The algorithm described in this document, as well as the descriptions is based on [1]. Figure 1: Definition of each axis.
Overview
From the characteristics that can be used to analyze running or walking, we choose acceleration as the relevant parameter. The three components of motion for an individual (and their related axes) are forward (roll), vertical (yaw), and side (pitch), as shown in Figure 1. The 3-axis accelerometer senses acceleration along its three axes: x, y, and z. The pedometer will be in an unknown orientation, so the measurement accuracy should not depend critically on the relationship between the motion axes and the accelerometer’s measurement axes.
SLIDE 2
Figure 2: Walking stages and acceleration pattern Let’s think about the nature of walking. Figure 1 depicts a single step, defined as a unit cycle of walking behavior, showing the relationship between each stage of the walking cycle and the change in vertical and forward acceleration. Figure 2 shows a typical pattern of x-, y-, and z- measurements corresponding to vertical, forward, and side acceleration of a running person. The figure should give you confidence that you’re on the right track - the large spikes corresponding to each step, and the periodic nature of walking/running, suggest that we should be able to detect these patterns. Figure 3: Typical pattern of x-, y-, and z accelerations measured on a running individual. But Figure 3 is misleading - if you take a few traces with the phone oriented in different ways in your pocket, you will quickly realize that the shape of the x, y, z curves depends on the orientation of the phone! While the figure shows the z-axis acceleration to be the largest, this may not be the case if the x- axis is oriented downward, and z-axis is oriented along the horizontal plane. More generally, the acceleration changes as a result of the step can result in changes along all the three axes, so we need to design an orientation-independent algorithm. [As an aside, if you are interested in knowing how phones calculate their tilt and the orientation of the phone, check this application note on accelerometers.] The key insight that we use is that at least one axis will have relatively large periodic acceleration
SLIDE 3 changes, no matter how the pedometer is worn, so we have the continuously track how the three axes are changing, and use dynamic peak detection thresholds to determine whether a step has occurred.
Step Detection Algorithm
There are several steps to step detection. We outline each of these in this section. Smoothing: When looking at the signal in Figure 3, you probably noticed that it doesn’t look very
- smooth. Lets try to fix this problem by smoothing the signal. A simple way to smooth a signal is to
average nearby values to remove some of the noise. For example, you can replace each sample by the average of the current sample, the sample before it, and the sample after it. If you did this to the z-axis in Figure 2, it would look as shown in green in Figure 3. You can try different smoothing windows if you want to see its effect. As you increase the smoothing window, the signal will look cleaner and more visually pleasing, but beware of using too large a window since you will smooth out the steps that you want to detect in the first place! Figure 4: Filtered data on the most active axis. Dynamic Detection Threshold: Given the smoothed data, our next problem is to determine when a step
- ccurs. From looking at the figure, you could probably come up with a few potential algorithms. For
example, if we could extract the peak point of each step, we can simply count the steps. The challenge, however, is that there is no fixed threshold that you can use since the threshold depends on the
- rientation of your accelerometer as described earlier. So, we need to use a dynamic thresholding
scheme to detect a step. The first step in this algorithm is keeping track of the axis (x, y, or z) along which the maximum acceleration occurs. We can ignore all other axes and just focus on this specific one for our algorithm. Given this axis, we keep track of the min and max acceleration levels over a window of samples. In other words, we continuously measure the maximum and minimum values of the 3-axis acceleration every 50
- samples. The average value, (Max + Min)/2, is called the dynamic threshold level. For the following 50
SLIDE 4 samples, this threshold level is used to decide whether steps have been taken. As it is updated every 50 samples, the threshold is dynamic. The Max, Min, and (dynamic) Threshold for the z-axis is shown in Figure 4. Step Detection Algorithm: Given the dynamic detection threshold, the step detection algorithm can work by looking for crossings of the threshold in the downward (or upward) direction. For example, if you look at Figure 4, you will see that each step involves a crossing of the threshold (orange line) in the downward direction with a substantial change in acceleration in the negative direction. In other words: A step is defined as happening if there is a negative slope of the acceleration plot (sample_new < sample_old) when the acceleration curve crosses below the dynamic threshold. Note that this is just one possible algorithm for detecting steps. It won’t be perfect, and better algorithms are possible. I encourage you to try other schemes, and refine the step detection algorithm to improve its
- accuracy. If you find a better approach, please let me know!
Periodicity: The step counter calculates the steps from the x-axis, y-axis, or z-axis, depending on which axis’s acceleration change is the largest one. If the changes in acceleration are too small, the step counter will discard them. The step counter can work well by using this algorithm, but sometimes it seems too sensitive. When the pedometer vibrates very rapidly or very slowly from a cause other than walking or running, the step counter will also take it as a step. Such invalid vibrations must be discarded in order to find the true rhythmic steps. Here are two simple approaches to solve this problem. The first approach is to look at the time period between any two steps. We assume that people can run as rapidly as five steps per second and walk as slowly as one step every two seconds. Thus, the interval between two valid steps is in the range [0.2 s to 2.0 s]; all steps with intervals outside the time window can be discarded to reduce some sources of error. A second approach is to look for a periodic walking pattern. You can look at the time between steps and see if the duration repeats (roughly with small variations) - a repeated pattern would suggest that the person is indeed walking.
Alternate Step Detection Algorithms
The algorithm for step detection that we just described is just one possible approach for detecting steps. It won’t be perfect, and better algorithms are possible. In that spirit, I’m going to give you an alternative that uses an altogether different approach. Extract 3D vector: In the previously described algorithm, we selected the axis along which maximum acceleration occurred and focused on that one. Here, we are just going to take the magnitude of the entire acceleration vector i.e. √𝑦2 + 𝑧2+𝑨2, where x, y, and z are the readings of the accelerometer along the three axes. Use low-pass filter: The second step is to remove noise, and extract the specific signal corresponding to walking. In the previous algorithm, we used moving average smoothing; here, we are going to use frequency-domain noise removal. A simple solution is to use a low pass filter that keeps only frequencies relating to walking and removes the rest. For example, we know that typical walking pace may be under
SLIDE 5
two steps a second (2 Hz), so perhaps we remove all frequencies above 3 Hz (just to give some margin for error). Note that this method would not be able to detect running or bicycling, which may have higher pace. Detect step using derivative: Once you have the smoothed data, let us consider how to detect the step. We could do what was suggested earlier, which is to compute a dynamic threshold and look for crossings of the threshold. Another approach is to take the derivative (slope) of the smoothed acceleration signal. The derivative changes from negative to positive (or positive to negative) exactly when a step occurs, so you can just count the number of times the derivative changed from negative to positive to detect the number of steps that occurred. The figure above shows the different steps of the algorithm we just described. For more details, refer to [4]. These are just two methods, and there are many variants. I encourage you to try other schemes, and refine the step detection algorithm to improve its accuracy. If you find a better approach, please let me know!
Counting Calories
Determining the exact number of calories expended by an individual based on the number of steps that
SLIDE 6 they have taken is an approximate science, and there is no accurate means of obtaining this measure. However, there are some useful heuristics that can be applied, and we are going to explore one of them. The basic idea is to figure out the running/walking speed of the individual (distance/time), and then use information about the weight to determine calories expended. Estimating Distance Covered: After computing the steps parameter according to the algorithm above, we can use Equation 1 to get the distance parameter. Distance = number of steps × distance per step (1) Distance per step depends on the speed and the height of user. The step length would be longer if the user is taller or running at higher speed. We use the steps counted in every two seconds to judge the current stride length. Table 2 shows the experimental data used to judge the current stride. Table 2. Stride as a Function of Speed (steps per 2 s) and Height Estimating Speed: Speed = distance/time, so Equation 2 can be used to get the speed parameter, as steps per 2 s and stride have all been calculated according to the algorithm above. Speed = steps per 2 s × stride/2 s (2) Estimating Calories: Unfortunately, there is no accurate means for calculating the rate of expending
- calories. Some factors that determine it include body weight, intensity of workout, conditioning level, and
- metabolism. We can estimate it using a conventional approximation, however. Table 3 shows a typical
relationship between calorie expenditure and running speed.
SLIDE 7
Table 3. Calories Expended vs. Running Speed From Table 3, we can get (3). Calories (C/kg/h) = 1.25 × running speed (km/h) (3) The unit of the speed parameter used above is m/s; converting km/h to m/s gives Equation 4. Calories (C/kg/h) = 1.25 × speed (m/s) × 3600/1000 = 4.5 × speed (m/s) (4) The calories parameter would be updated every 2s with the distance and speed parameters. So, to account for a given athlete’s weight, we can convert Equation 4 to Equation 5 as indicated. Weight (kg) is a user input, and one hour is equal to 1800 two second intervals. Calories (C/2 s) = 4.5 × speed × weight/1800 = speed × weight/400 (5) If the user takes a break in place after walking or running, there would be no change in steps and distance, speed should be zero, then the calories expended can use Equation 6 since the caloric expenditure is around 1 C/kg/hour while resting. Calories (C/2 s) = 1 × weight/1800 (6) Finally, we can add calories for all 2-second intervals together to get the total calories expended.
Class Demo
If you have Matlab, you can try out this quick demo that I used in class. (You will be using a different system for your assignments, so don’t worry if you don’t have access to Matlab) Matlab is available to UMass students (may require a fee - see instructions below). https://www.it.umass.edu/support/software/mathworks-licenses-matlab-simulink-and-symbolic-math- toolbox Install the Matlab Connector on your Android or iOS device. http://www.mathworks.com/mobile/features.html?refresh=true&s_tid=gn_loc_drop
SLIDE 8 Matlab has a step counting demo that you can try out http://www.mathworks.com/help/supportpkg/iossensor/examples/counting-steps-by-capturing- acceleration-data-from-your-apple-ios-device.html Here is the code that I showed in class based on their demo. Start it in Matlab, and walk around for 40 seconds or so. Count the number of steps you take. See if the Matlab code gives you the correct number
- f steps. Feel free to try alternate methods.
https://drive.google.com/file/d/0Bw0KEeNzOgzFMmpfRXRzMVdnQ0U/view?usp=sharing
References
[1] Full-Featured Pedometer Design Realized with 3-Axis Digital Accelerometer, Neil Zhao [2] Step Detection Algorithms for Accelerometers, Guillaume Thuer and Tim Verwimp [3] Calorie counting calculation, Beth Spicer [4] A simple method for reliable footstep detection on embedded sensor platforms, Ryan Libby