Chapter 15 15.1 Properties of Stars Surveying the Stars Our goals - - PDF document

chapter 15 15 1 properties of stars surveying the stars
SMART_READER_LITE
LIVE PREVIEW

Chapter 15 15.1 Properties of Stars Surveying the Stars Our goals - - PDF document

Chapter 15 15.1 Properties of Stars Surveying the Stars Our goals for learning How do we measure stellar luminosities? How do we measure stellar temperatures? How do we measure stellar masses? How do we measure stellar


slide-1
SLIDE 1

1

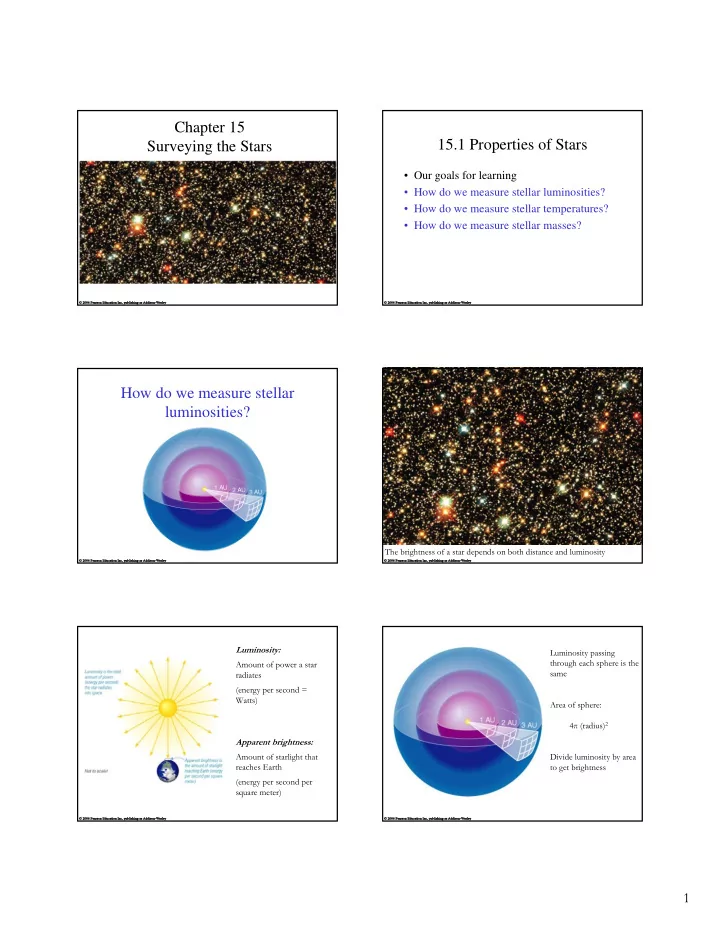
Chapter 15 Surveying the Stars 15.1 Properties of Stars

  • Our goals for learning
  • How do we measure stellar luminosities?
  • How do we measure stellar temperatures?
  • How do we measure stellar masses?

How do we measure stellar luminosities?

The brightness of a star depends on both distance and luminosity Luminosity: Amount of power a star radiates (energy per second = Watts) Apparent brightness: Amount of starlight that reaches Earth (energy per second per square meter) Luminosity passing through each sphere is the same Area of sphere: 4π (radius)2 Divide luminosity by area to get brightness

slide-2
SLIDE 2

2

The relationship between apparent brightness and luminosity depends on distance: Luminosity Brightness = 4π (distance)2 We can determine a star’s luminosity if we can measure its distance and apparent brightness: Luminosity = 4π (distance)2 x (Brightness) So how far are these stars?

Parallax is the apparent shift in position of a nearby object against a background of more distant

  • bjects

Apparent positions of nearest stars shift by about an arcsecond as Earth

  • rbits Sun

Parallax angle depends on distance Parallax is measured by comparing snapshots taken at different times and measuring the shift in angle to star

slide-3
SLIDE 3

3

Parallax and Distance

p = parallax angle d (in parsecs) = 1 p (in arcseconds) d (in light - years) = 3.26 × 1 p (in arcseconds)

Most luminous stars: 106 LSun Least luminous stars: 10-4 LSun (LSun is luminosity

  • f Sun)

The Magnitude Scale

m = apparent magnitude , M = absolute magnitude apparent brightness of Star 1 apparent brightness of Star 2 = (1001/ 5)m1−m2 luminosity of Star 1 luminosity of Star 2 = (1001/5)M 1−M 2

How do we measure stellar temperatures?

Every object emits thermal radiation with a spectrum that depends on its temperature

slide-4
SLIDE 4

4

An object of fixed size grows more luminous as its temperature rises

Properties of Thermal Radiation

  • 1. Hotter objects emit more light per unit area at all

frequencies.

  • 2. Hotter objects emit photons with a higher average

energy.

Hottest stars: 50,000 K Coolest stars: 3,000 K (Sun’s surface is 5,800 K)

Solid Molecules Neutral Gas Ionized Gas (Plasma)

Level of ionization also reveals a star’s temperature

10 K 102 K 103 K 104 K 105 K 106 K

Absorption lines in star’s spectrum tell us ionization level

Lines in a star’s spectrum correspond to a spectral type that reveals its temperature (Hottest) O B A F G K M (Coolest)

slide-5
SLIDE 5

5

(Hottest) O B A F G K M (Coolest)

Remembering Spectral Types

  • Oh, Be A Fine Girl, Kiss Me
  • Only Boys Accepting Feminism Get Kissed

Meaningfully

Pioneers of Stellar Classification

  • Annie Jump

Cannon and the “calculators” at Harvard laid the foundation of modern stellar classification

How do we measure stellar masses?

The orbit of a binary star system depends on strength of gravity

Types of Binary Star Systems

  • Visual Binary
  • Eclipsing Binary
  • Spectroscopic Binary

About half of all stars are in binary systems

Visual Binary

We can directly observe the orbital motions of these stars

slide-6
SLIDE 6

6

Eclipsing Binary

We can measure periodic eclipses

Spectroscopic Binary

We determine the orbit by measuring Doppler shifts

Isaac Newton We measure mass using gravity Direct mass measurements are possible only for stars in binary star systems p = period a = average separation p2 = a3 4π2 G (M1 + M2)

Need 2 out of 3 observables to measure mass:

1) Orbital Period (p) 2) Orbital Separation (a or r = radius) 3) Orbital Velocity (v) For circular orbits, v = 2πr / p

r M v

Most massive stars: 100 MSun Least massive stars: 0.08 MSun (MSun is the mass

  • f the Sun)

What have we learned?

  • How do we measure stellar luminosities?

– If we measure a star’s apparent brightness and distance, we can compute its luminosity with the inverse square law for light – Parallax tells us distances to the nearest stars

  • How do we measure stellar temperatures?

– A star’s color and spectral type both reflect its temperature

slide-7
SLIDE 7

7

What have we learned?

  • How do we measure stellar masses?

– Newton’s version of Kepler’s third law tells us the total mass of a binary system, if we can measure the orbital period (p) and average

  • rbital separation of the system (a)

15.2 Patterns among Stars

  • Our goals for learning
  • What is a Hertzsprung-Russell diagram?
  • What is the significance of the main

sequence?

  • What are giants, supergiants, and white

dwarfs?

  • Why do the properties of some stars vary?

What is a Hertzsprung-Russell diagram?

Temperature Luminosity An H-R diagram plots the luminosity and temperature

  • f stars

Most stars fall somewhere on the main sequence of the H-R diagram

slide-8
SLIDE 8

8

Stars with lower T and higher L than main- sequence stars must have larger radii:

giants and supergiants

Large radius Small radius

Stars with higher T and lower L than main- sequence stars must have smaller radii:

white dwarfs

A star’s full classification includes spectral type (line identities) and luminosity class (line shapes, related to the size of the star): I - supergiant II - bright giant III - giant IV - subgiant V - main sequence Examples: Sun - G2 V Sirius - A1 V Proxima Centauri - M5.5 V Betelgeuse - M2 I

Temperature Luminosity

H-R diagram depicts: Temperature Color Spectral Type Luminosity Radius

What is the significance of the main sequence?

Main-sequence stars are fusing hydrogen into helium in their cores like the Sun Luminous main- sequence stars are hot (blue) Less luminous

  • nes are cooler

(yellow or red)

slide-9
SLIDE 9

9

Mass measurements of main-sequence stars show that the hot, blue stars are much more massive than the cool, red ones

High-mass stars Low-mass stars

The mass of a normal, hydrogen- burning star determines its luminosity and spectral type!

High-mass stars Low-mass stars

Core pressure and temperature of a higher-mass star need to be larger in order to balance gravity Higher core temperature boosts fusion rate, leading to larger luminosity

Stellar Properties Review

Luminosity: from brightness and distance 10-4 LSun - 106 LSun Temperature: from color and spectral type 3,000 K - 50,000 K Mass: from period (p) and average separation (a)

  • f binary-star orbit

0.08 MSun - 100 MSun

Stellar Properties Review

Luminosity: from brightness and distance 10-4 LSun - 106 LSun Temperature: from color and spectral type 3,000 K - 50,000 K Mass: from period (p) and average separation (a)

  • f binary-star orbit

0.08 MSun - 100 MSun (0.08 MSun)

(100 MSun) (100 MSun)

(0.08 MSun)

Mass & Lifetime

Sun’s life expectancy: 10 billion years

slide-10
SLIDE 10

10

Mass & Lifetime

Sun’s life expectancy: 10 billion years

Until core hydrogen (10% of total) is used up

Mass & Lifetime

Sun’s life expectancy: 10 billion years Life expectancy of 10 MSun star: 10 times as much fuel, uses it 104 times as fast 10 million years ~ 10 billion years x 10 / 104

Until core hydrogen (10% of total) is used up

Mass & Lifetime

Sun’s life expectancy: 10 billion years Life expectancy of 10 MSun star: 10 times as much fuel, uses it 104 times as fast 10 million years ~ 10 billion years x 10 / 104 Life expectancy of 0.1 MSun star: 0.1 times as much fuel, uses it 0.01 times as fast 100 billion years ~ 10 billion years x 0.1 / 0.01

Until core hydrogen (10% of total) is used up

Main-Sequence Star Summary

High Mass: High Luminosity Short-Lived Large Radius Blue Low Mass: Low Luminosity Long-Lived Small Radius Red

What are giants, supergiants, and white dwarfs? Off the Main Sequence

  • Stellar properties depend on both mass and age:

those that have finished fusing H to He in their cores are no longer on the main sequence

  • All stars become larger and redder after

exhausting their core hydrogen: giants and supergiants

  • Most stars end up small and white after fusion has

ceased: white dwarfs

slide-11
SLIDE 11

11

Why do the properties of some stars vary? Variable Stars

  • Any star that varies significantly in brightness

with time is called a variable star

  • Some stars vary in brightness because they cannot

achieve proper balance between power welling up from the core and power radiated from the surface

  • Such a star alternately expands and contracts,

varying in brightness as it tries to find a balance

Pulsating Variable Stars

  • The light curve of this pulsating variable star shows

that its brightness alternately rises and falls over a 50-day period

Cepheid Variable Stars

  • Most pulsating

variable stars inhabit an instability strip

  • n the H-R diagram
  • The most luminous
  • nes are known as

Cepheid variables

What have we learned?

  • What is a Hertzsprung-Russell diagram?

– An H-R diagram plots stellar luminosity of stars versus surface temperature (or color or spectral type)

  • What is the significance of the main

sequence?

– Normal stars that fuse H to He in their cores fall on the main sequence of an H-R diagram – A star’s mass determines its position along the main sequence (high-mass: luminous and blue; low-mass: faint and red)

slide-12
SLIDE 12

12

What have we learned?

  • What are giants, supergiants, and white

dwarfs?

– All stars become larger and redder after core hydrogen burning is exhausted: giants and supergiants – Most stars end up as tiny white dwarfs after fusion has ceased

  • Why do the properties of some stars vary?

– Some stars fail to achieve balance between power generated in the core and power radiated from the surface

15.3 Star Clusters

  • Our goals for learning
  • What are the two types of star clusters?
  • How do we measure the age of a star

cluster?

What are the two types of star clusters?

Open cluster: A few thousand loosely packed stars Globular cluster: Up to a million or more stars in a dense ball bound together by gravity

How do we measure the age of a star cluster?

slide-13
SLIDE 13

13

Massive blue stars die first, followed by white, yellow,

  • range,

and red stars Pleiades now has no stars with life expectancy less than around 100 million years

Main-sequence turnoff

Main- sequence turnoff point

  • f a cluster

tells us its age

To determine accurate ages, we compare models of stellar evolution to the cluster data

Detailed modeling of the oldest globular clusters reveals that they are about 13 billion years

  • ld

What have we learned?

  • What are the two types of star clusters?

– Open clusters are loosely packed and contain up to a few thousand stars – Globular clusters are densely packed and contain hundreds of thousands of stars

  • How do we measure the age of a star

cluster?

– A star cluster’s age roughly equals the life expectancy of its most massive stars still on the main sequence