
SLIDE 1
3/1/2016 1
March 11th, 2016
Environmental Risk Assessment
- Daniel G Sauvé, MSc.
- Senior Evaluation Officer, Environmental Risk Section III
- Environmental Assessment Directorate
Pest Management Regulatory Agency
2
Overview
- The PMRA
- Role of EAD
- Exposure assessment
- Toxicology assessment
- Risk characterization
- Risk mitigation
- Conclusion
3
Mandate of PMRA
- Protecting the health and environment of Canadians and
supporting Canadian competitiveness by regulating pest control products (pesticides) and their use in an effective and transparent manner.
4
- Assess scientific data on the ecotoxicology and
environmental fate and behaviour of pesticides;
- Conduct environmental risk assessments
- Recommend mitigation measures;
- Document scientific literature
- Participate in scientific committees within PMRA, HC
and other departments and institutions (USEPA, OECD, NAFTA, etc.)
- Other projects: Improvment of risk assessment methods,
buffer zones, water modeling, Tech teams, etc.
Environmental Assessment Directorate (EAD)
5
Objectives of environmental risk assessment
- Evaluate the likelihood that adverse ecological effects may
- ccur (or are occurring) following exposure to pesticides
and/or their transformation products
- Determine if changes in the use pattern (or proposed use
pattern) are required to better protect the environment
6
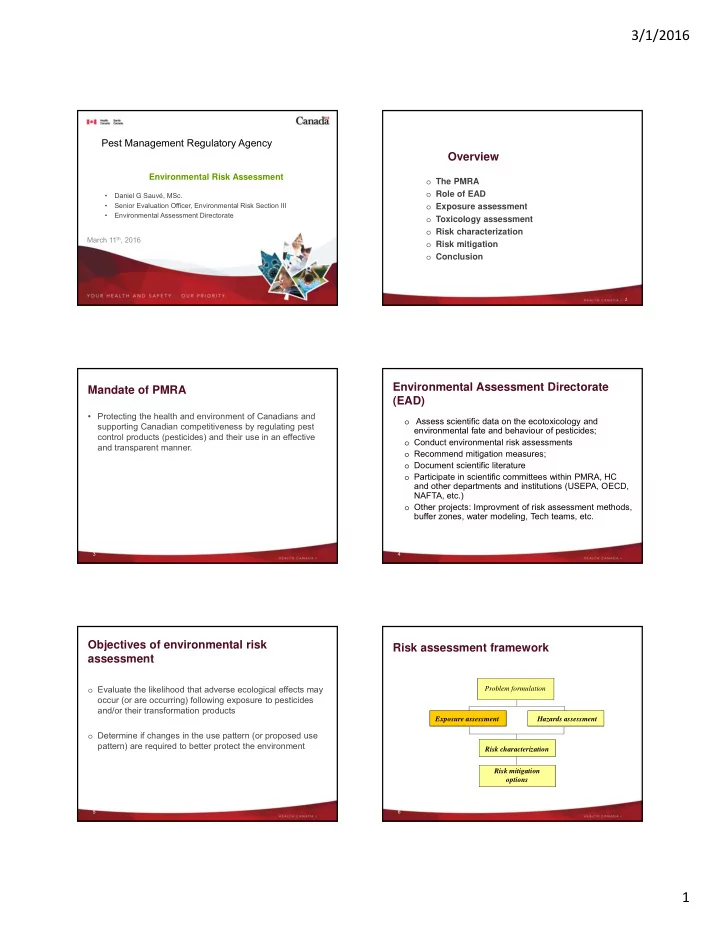
Risk assessment framework
Exposure assessment Hazards assessment Risk characterization Risk mitigation
- ptions
Problem formulation