Challenges of forecasting with fat tailed data Aaron Clauset - - PowerPoint PPT Presentation

challenges of forecasting with fat tailed data
SMART_READER_LITE
LIVE PREVIEW

Challenges of forecasting with fat tailed data Aaron Clauset - - PowerPoint PPT Presentation

Challenges of forecasting with fat tailed data Aaron Clauset @aaronclauset Assistant Professor, Computer Science and BioFrontiers Institute, University of Colorado Boulder External Faculty, Santa Fe Institute 15 October 2013 lion people, 1


slide-1
SLIDE 1

lion people,

Aaron Clauset @aaronclauset Assistant Professor, Computer Science and BioFrontiers Institute, University of Colorado Boulder External Faculty, Santa Fe Institute

Challenges of forecasting with fat tailed data

15 October 2013 1

slide-2
SLIDE 2

Cosma Shalizi joint work with Mark Newman Ryan Woodard

2

slide-3
SLIDE 3
  • 1. predicting the unpredictable
  • 2. modeling rare events
  • 3. historical probability
  • 4. statistical forecast
  • 5. financial data
  • 6. outlook

3

slide-4
SLIDE 4
  • 1. predicting the unpredictable

complex systems “heavy” or “fat” tailed quantities

  • book sales
  • earthquakes
  • terrorist attacks
  • civil or international wars
  • stock market crashes
  • electrical power outages
  • solar flare intensity
  • etc. etc.

4

slide-5
SLIDE 5

10 10

2

10

4

10

5

10

4

10

3

10

2

10

1

10 P(x) (a) 10 10

1

10

2

10

4

10

3

10

2

10

1

10 (b) 10 10

1

10

2

10

3

10

4

10

2

10 (c) metabolic 10 10

2

10

4

10

5

10

4

10

3

10

2

10

1

10 P(x) (d) Internet 10 10

2

10

4

10

6

10

6

10

4

10

2

10 (e) calls words proteins 10 10

1

10

2

10

3

10

2

10

1

10 (f) wars 10 10

2

10

4

10

5

10

4

10

3

10

2

10

1

10 P(x) (g) terrorism 10

2

10

4

10

6

10

8

10

6

10

4

10

2

10 (h) 10 10

1

10

2

10

3

10

2

10

1

10 (i) species 10 10

2

10

4

10

6

10

3

10

2

10

1

10 x P(x) (j) 10

3

10

4

10

5

10

6

10

7

10

3

10

2

10

1

10 x (k) 10

6

10

7

10

3

10

2

10

1

10 x (l) HTTP birds blackouts book sales 10 10

2

10

4

10

6

10

8

10

5

10

4

10

3

10

2

10

1

10 P(x) (m) 10 10

1

10

2

10

3

10

4

10

3

10

2

10

1

10 (n) 10 10

2

10

4

10 10

6

10

5

10

4

10

3

10

2

10

1

10 (o) cities email fires 10

1 10 2 10 3 10 4 10 5 10 6

10

5

10

4

10

3

10

2

10

1

10 P(x) (p) flares 10 10

2

10

4

10

6

10

8

10

5

10

4

10

3

10

2

10

1

10 (q) 10

6

10

7

10

8

10 10

2

10

1

10 (r) religions 10

4

10

5

10

6

10

7

10

4

10

3

10

2

10

1

10 P(x) (s) surnames 10

8

10

9

10

10

10

11

10

3

10

2

10

1

10 (t) 10 10

1

10

2

10

3

10 10

6

10

5

10

4

10

3

10

2

10

1

10 (u) citations 10 10

1

10

2

10

3

10

6

10

5

10

4

10

3

10

2

10

1

10 x P(x) (v) authors 10

0 10 1 10 2 10 3 10 4 10 5

10

5

10

4

10

3

10

2

10

1

10 x (w) web hits 10 10

2

10

4

10

6

10

10

10

8

10

6

10

4

10

2

10 x (x) web links quakes wealth

24 empirical data sets

5

slide-6
SLIDE 6
  • 1. predicting the unpredictable

complex systems “heavy” or “fat” tailed quantities

  • book sales
  • earthquakes
  • terrorist attacks
  • civil or international wars
  • stock market crashes
  • electrical power outages
  • solar flare intensity
  • etc. etc.

6

slide-7
SLIDE 7

1906 San Francisco, M7.8 2008 Sichuan, M7.9 2011 Japan, M8.9

7

slide-8
SLIDE 8

Gutenberg-Richter law

50 100 150 200 250 300 1 2 3 4 5 6 7 8 9 Magnitude, M Earthquake number 1 2 3 4 5 6 0.001 0.01 0.1 1 Proportion M

frequency vs. size earthquake physics

(frequency) ∝ (seismic moment)−α

8

slide-9
SLIDE 9

20 40 60 80 10

3

10

4

10

5

10

6

10

7

10

8

10

9

10

10

Interstate war number (1816 − 2007) Battle deaths, S (severity) WWI WWII

earthquakes vs. wars inter-state wars 1816-2007

10

3

10

4

10

5

10

6

10

7

10

8

10

−2

10

−1

10 Proportion S

(frequency) ∝ (deaths)−α

9

slide-10
SLIDE 10

2000 4000 6000 8000 10000 10

1

10

2

10

3

10

4

Severity, S (deaths) Attack number (Jan 1998−2008)

9−11

1 2 3 4 10

−4

10

−3

10

−2

10

−1

10 Proportion S

earthquakes vs. global terrorism

  • Jan. 1998-2008

13,274 deadly attacks worldwide Richardson’s law (1941)

(frequency) ∝ (deaths)−α

10

slide-11
SLIDE 11

earthquakes terrorism & insurgency Gutenberg-Richter law Richardson’s law physics largely known processes largely unknown processes fixed processes dynamic, adaptive forecasting possible (years of successes) how do we forecast? prediction very hard (years of failures) what can we predict? what can we not predict?

F ∝ M −α F ∝ S−α

11

slide-12
SLIDE 12
  • 1. predicting the unpredictable
  • 2. modeling rare events
  • 3. historical probability
  • 4. statistical forecast
  • 5. financial data
  • 6. outlook

12

slide-13
SLIDE 13
  • 2. modeling rare events
  • not in financial markets (yet)
  • but in global terrorism
  • how probable was a 9/11-sized event?
  • how probable is another 9/11-sized event?

13

slide-14
SLIDE 14

1−9 10−99 100−999 1000+ 2000 4000 6000 8000 10000 12000 14000

12280 957 36 1

deaths per attack number of incidents

deadly terrorist events, 1968-2008

RAND-MIPT event database

14

slide-15
SLIDE 15

1−9 10−99 100−999 1000+ 2000 4000 6000 8000 10000 12000 14000

12280 957 36 1

deaths per attack number of incidents

“normal,” 92% large, 8%

{

{

{

very large, 0.3%

RAND-MIPT event database

deadly terrorist events, 1968-2008

15

slide-16
SLIDE 16

how probable was a 9/11-sized event?

Pr(x)

requires a probability model

16

slide-17
SLIDE 17

key observations

  • care only about large events

disproportionate consequences

  • unknown upper tail structure

several models fit well

  • little data in upper tail

large statistical uncertainty

how probable was a 9/11-sized event?

requires a probability model Pr(x)

17

slide-18
SLIDE 18

key observations

  • care only about large events

disproportionate consequences

  • unknown upper tail structure

several models fit well

  • little data in upper tail

large statistical uncertainty

separate tail from body multiple tail models distribution over conclusions

how probable was a 9/11-sized event?

model-based, data-driven forecasts requires a probability model Pr(x)

18

slide-19
SLIDE 19
  • 1. predicting the unpredictable
  • 2. modeling rare events
  • 3. historical probability
  • 4. statistical forecast
  • 5. financial data
  • 6. outlook

19

slide-20
SLIDE 20

10 10

1

10

2

10

3

10

4

10

−5

10

−4

10

−3

10

−2

10

−1

10 Pr(Xx) severity, x (deaths)

9/11

step 1: the data

Terrorism event data from RAND-MIPT Terrorism Knowledge Base (2008). 40 years of data (1968-2007) Worldwide (~200 countries) 13,274 deadly events Each event is localized in time and space, and MIPT records its severity (deaths). 9/11 recorded as three events; the NYC event records 2749 deaths.

20

slide-21
SLIDE 21

Choose such that is minimized. Here, we let be the KS-statistic.

10 10

1

10

2

10

3

10

4

10

−5

10

−4

10

−3

10

−2

10

−1

10 Pr(Xx) severity, x (deaths)

9/11

step 2: separate tail from body body tail

d h S(x ≥ y), F(x ≥ y | ˆ θ) i xmin = y d[·, ·]

21

slide-22
SLIDE 22

10 10

1

10

2

10

3

10

4

10

−5

10

−4

10

−3

10

−2

10

−1

10 Pr(Xx) severity, x (deaths)

9/11

step 2: model the upper tail body tail

Pareto distribution

Let for values . For the empirical data, we estimate , with . This yields 994 tail events (7.5%). A Monte Carlo hypothesis test finds , meaning the power law cannot be rejected as a model of these data. A likelihood ratio test finds the stretched exponential and log- normal distributions also plausible.

Pr(x) ∝ x−α x ≥ xmin ˆ α = 2.4 ± 0.1 p = 0.68 ± 0.03 xmin = 10

22

slide-23
SLIDE 23

10 10

1

10

2

10

3

10

4

10

−5

10

−4

10

−3

10

−2

10

−1

10 Pr(X x) severity, x (deaths)

9/11

2.2 2.4 2.6 Pr()

step 3: bootstrap the data and repeat

Pareto distribution

Given observed event sizes, generate by drawing , , uniformly at random, with replacement from the observed events. For each tail model the MLE parameter choice is deterministic. The produces a bootstrap distribution that capture the statistical uncertainty within this model.

Y n yj j = 1, . . . , n X = {xi} Pr(x | θ, xmin) θ(Y, xmin) Pr(θ, xmin)

23

slide-24
SLIDE 24

10 10

1

10

2

10

3

10

4

10

−5

10

−4

10

−3

10

−2

10

−1

10 severity, x (deaths) Pr(Xx)

9/11

step 4: repeat with alternative models

Pareto distribution Stretched exponential Log-normal

Repeat the above steps, but with additional tail models. Here, we choose: Stretched exponential Log-normal Both of which cannot be rejected, under a LRT, as a model of events . Multiple tail models better represents model uncertainty.

Pr(x) ∝ xβ−1e−λx−β Pr(x) ∝ 1 xe− (ln x−µ)2

2σ2

x ≥ xmin = 10

24

slide-25
SLIDE 25

0.2 0.4 0.6 0.8 1 Probability(1+ catastrophic event, 1968−2007) Density

power law (1) power law (2) stretched exp. log−normal

step 5: derive probabilities

In each sample, the probability of a tail event is And the number of such events will be The probability that at least one is “catastrophic” (size ) is thus where is the fitted cdf. Via Monte Carlo, we may construct a distribution over these estimates for each tail model. If , call the event an outlier.

ntail ∼ Binomial(n, ptail) ptail = #{xi ≥ xmin}/n Pr(ρ) ≥ x ρ = 1−F(x | θ(Y, xmin))ntail F(x | θ) hρi < 0.01

25

slide-26
SLIDE 26

0.2 0.4 0.6 0.8 1 Probability(at least one catastrophic event, 1968−2007) Density

power law (1) power law (2) stretched exp. log−normal

  • est. Pr(x ≥ 2749)
  • est. prob. ρ,

90% CI tail model parameters per event, q(x) 1968–2007 (bootstrap) power law (1) Pr(ˆ α), xmin = 10 0.0000270200 0.299 [0.203, 0.405] power law (2) Pr(ˆ α, ˆ xmin) 0.0000346345 0.347 [0.182, 0.669] stretched exp. Pr(ˆ β, ˆ λ), xmin = 10 0.0000156780 0.187 [0.115, 0.272] log-normal Pr(ˆ µ, ˆ σ), xmin = 10 0.0000090127 0.112 [0.063, 0.172]

probability per event 40 year probability

historical estimates

confidence intervals

26

slide-27
SLIDE 27
  • all tail models agree
  • similar results for analysis with covariates (PL model):
  • economically developed nations
  • by type of weapon
  • events before 1998

at least one 9/11-sized event was not statistically unlikely, given empirical frequency of large events

how probable was a 9/11-sized event?

ρ > 0.01

ˆ ρ = 0.475 ˆ ρ = 0.225 ˆ ρ = 0.564

27

slide-28
SLIDE 28
  • 1. predicting the unpredictable
  • 2. modeling rare events
  • 3. historical probability
  • 4. statistical forecast
  • 5. financial data
  • 6. outlook

28

slide-29
SLIDE 29

numerical estimation

  • 1. assume is stationary (fixed )
  • 2. estimate over forecast period
  • 3. estimate numerically as before, with observations
  • 4. repeat for multiple tail models

ntail(t) ntail(t) Pr(x | θ, xmin) ptail

29

slide-30
SLIDE 30

numerical estimation

  • 1. assume is stationary (fixed )
  • 2. estimate over forecast period
  • 3. estimate numerically as before, with observations
  • 4. repeat for multiple tail models

simplification: choose for (i) optimistic, (ii) status quo, (iii) pessimistic scenarios ntail(t) ntail(t) Pr(x | θ, xmin) ptail nyear

30

slide-31
SLIDE 31

three scenarios

1999 2001 2003 2005 2007 2009 10

2

10

3

10

4

Year Deadly events per year

  • ptimistic

status quo pessimistic

past future World World − {Iraq,Afghan.} 1999 2001 2003 2005 2007 ... 2021 0.1 Pr(X10)

ptail = 0.082684 nyear ≈ 400 nyear ≈ 2000 nyear ≈ 10,000

31

slide-32
SLIDE 32

future probabilities

Pr(x ≥ 2749) forecast, 2012-2021 “optimistic” “status quo” “pessimistic” tail model nyear ≈ 400 nyear ≈ 2000 nyear ≈ 10, 000 power law 0.117 0.461 0.944 stretched exp. 0.072 0.306 0.823 log-normal 0.043 0.193 0.643

32

slide-33
SLIDE 33

assumptions

  • stationary process for event production,

[but: technology, culture, population size, etc.]

  • stationary process for event sizes

[but: technology, politics, population size, etc.]

  • large events follow same distribution as very large ones

[but: different technologies, e.g., chemical, biological, nuclear]

  • events are independent

[but: coupling from same group, same conflict, etc.]

caveats

ntail Pr(x)

  • pen questions
  • how to choose & compare tail models?
  • how to tighten confidence intervals?
  • how to deal with unknown non-stationary effects?

33

slide-34
SLIDE 34
  • 1. predicting the unpredictable
  • 2. modeling rare events
  • 3. historical probability
  • 4. statistical forecast
  • 5. financial data
  • 6. outlook

34

slide-35
SLIDE 35

a little financial data

  • 1. 43 stocks on London Stock Exchange (2000-2002)
  • 2. random sample of 50,000 positive returns
  • 3. what does the data look like?
  • 4. heavy tails?

35

slide-36
SLIDE 36

10

−2

10

−1

10 10

1

10

2

10

3

10

−5

10

−4

10

−3

10

−2

10

−1

10 Return size / xmin Pr(X x) 2 3 4 5

scaling exponent, Density

tails bodies

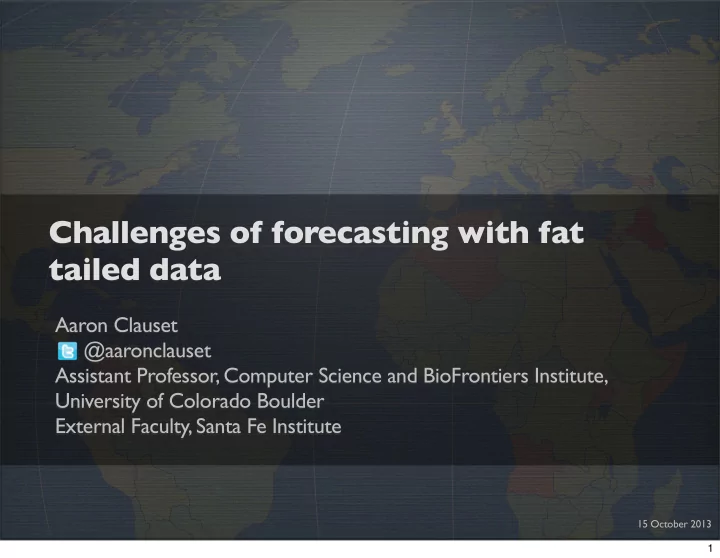
For each sample, estimate power-law tail parameters and Plot shows normalized return exceedance distribution Inset shows distribution of estimated power-law exponents , whose mean is . But, only about half of these are plausible power laws, with

xmin α Pr(X ≥ x/xmin) Pr(α) hαi = 3.77

AL, AZN, BAA, BLT, BOC, BOOT, BSY, CPI, GUS, HAS, HG, III, ISYS, LLOY, PRU, PSON, RB, REED, RIO, RTO, RTR, SBRY, SHEL, SSE, TSCO, UU, VOD

p ≥ 0.1

36

slide-37
SLIDE 37
  • 1. predicting the unpredictable
  • 2. modeling rare events
  • 3. historical probability
  • 4. statistical forecast
  • 5. financial data
  • 6. outlook

37

slide-38
SLIDE 38

historical probability

  • 9/11 severity not a statistical outlier (all models agree)
  • covariates contain useful information
  • mechanism-free estimates

future probability

  • stationarity and iid assumptions
  • large events remain uncomfortably likely
  • probability depends on sampling rate

modeling rare events

  • method is entirely general
  • covers both model and statistical uncertainty
  • applications to other complex social systems

nyear × ptail

rare events in terrorism

10 10

1

10

2

10

3

10

4

10

−5

10

−4

10

−3

10

−2

10

−1

10 Pr(X x) severity, x (deaths)

9/11

2.2 2.4 2.6 Pr()

38

slide-39
SLIDE 39

historical probability

  • 9/11 severity not a statistical outlier (all models agree)
  • covariates contain useful information
  • mechanism-free estimates

future probability

  • stationarity and iid assumptions
  • large events remain uncomfortably likely
  • probability depends on sampling rate

modeling rare events

  • method is entirely general
  • covers both model and statistical uncertainty
  • applications to other complex social systems

nyear × ptail

rare events in terrorism

10 10

1

10

2

10

3

10

4

10

−5

10

−4

10

−3

10

−2

10

−1

10 Pr(X x) severity, x (deaths)

9/11

2.2 2.4 2.6 Pr()

39

slide-40
SLIDE 40

historical probability

  • 9/11 severity not a statistical outlier (all models agree)
  • covariates contain useful information
  • mechanism-free estimates

future probability

  • stationarity and iid assumptions
  • large events remain uncomfortably likely
  • probability depends on sampling rate

modeling rare events

  • method is entirely general
  • covers both model and statistical uncertainty
  • applications to other complex social systems

nyear × ptail

rare events in terrorism

10 10

1

10

2

10

3

10

4

10

−5

10

−4

10

−3

10

−2

10

−1

10 Pr(X x) severity, x (deaths)

9/11

2.2 2.4 2.6 Pr()

40

slide-41
SLIDE 41

hard problem

  • model uncertainty

difficult to completely control -- model misspecification

  • statistical uncertainty

little data where you need it the most -- large tail fluctuations

  • stationarity and independence

assumptions of convenience -- never completely accurate

forecasting with heavy-tails in general

10

−2

10

−1

10 10

1

10

2

10

3

10

−5

10

−4

10

−3

10

−2

10

−1

10 Return size / xmin Pr(X x) 2 3 4 5

scaling exponent, Density

41

slide-42
SLIDE 42

hard problem

  • model uncertainty

difficult to completely control -- model misspecification

  • statistical uncertainty

little data where you need it the most -- large tail fluctuations

  • stationarity and independence

assumptions of convenience -- never completely accurate

  • ne possible approach
  • an ensemble of tail models that adapts to non-stationarity

forecasting with heavy-tails in general +

http://arxiv.org/abs/1103.0949 http://arxiv.org/abs/0706.1062

10

−2

10

−1

10 10

1

10

2

10

3

10

−5

10

−4

10

−3

10

−2

10

−1

10 Return size / xmin Pr(X x) 2 3 4 5

scaling exponent, Density

42

slide-43
SLIDE 43

further reading: Estimating the historical and future probabilities of large terrorist events

with R. Woodard Annals of Applied Statistics (2013) arxiv:1209.0089

Adapting to non-stationarity with growing expert ensembles

with C.R. Shalizi, A.Z. Jacobs & K.L. Klinkner arxiv:1103.0949 (2011)

A novel explanation of the power-law form of the frequency of severe terrorist events

with M. Young & K.S. Gleditsch Peace Economics, Peace Science and Public Policy (2010)

Power-law distributions in empirical data

with C.R. Shalizi & M.E.J. Newman SIAM Review (2009)

On the frequency of severe terrorist attacks

with M. Young & K.S. Gleditsch Journal of Conflict Resolution (2007)

  • Ryan Woodard
  • Cosma Shalizi
  • Mark Newman
  • Nils Weidmann
  • Julian Wücherpfennig
  • Kristian Skrede Gleditsch
  • Victor Asal
  • Didier Sornette
  • Lars-Erik Cederman
  • Patrick Meier

thanks code available at santafe.edu/~aaronc/rareevents/

43

slide-44
SLIDE 44

fin

44

slide-45
SLIDE 45

let = a bootstrap of observed data and let = known beginning of tail then and (number of tail events)

the method

ntail ∼ Binomial(n, ptail) ptail = #{xi ≥ xmin}/n Y {x1, . . . , xn} xmin

45

slide-46
SLIDE 46

let = a bootstrap of observed data and let = known beginning of tail then and (number of tail events) let = tail probability model on then = its maximum likelihood estimate on

the method

ntail ∼ Binomial(n, ptail) ptail = #{xi ≥ xmin}/n θ(Y, xmin) Y {x1, . . . , xn} Pr(x | θ, xmin) x ≥ xmin Y xmin

46

slide-47
SLIDE 47

probability that no tail events exceed =

the method

F(x | θ(Y, xmin))ntail = ✓Z x

xmin

Pr(y | ˆ θ, xmin)dy ◆ntail x

47

slide-48
SLIDE 48

probability that no tail events exceed = bootstrap probability of at least one event =

the method

= Z dy1 . . . dyntail (1−F(x; θ(Y, xmin))ntail)

ntail

Y

i=1

r(yi | ntail) p(ntail, θ) = p(ntail, Y ) x F(x | θ(Y, xmin))ntail = ✓Z x

xmin

Pr(y | ˆ θ, xmin)dy ◆ntail

48

slide-49
SLIDE 49

comments

is not known a priori

must be estimated jointly with for each bootstrap

is thus also Binomial, determined by

and is a mixture of these Binomials

thus, hard to calculate analytically but easy to calculate numerically

xmin ptail

θ Y

Y ρ = Pr(X ≥ x)

ntail

49

slide-50
SLIDE 50

numerical estimation

  • 1. given observed event sizes, generate by drawing ,

uniformly at random, with replacement from the

  • bserved
  • 2. jointly estimate tail model’s parameter and on and

compute

  • 3. set
  • 4. repeat to produce (for confidence intervals, etc.)

n Y yj {xi} θ xmin Y ntail ρ = 1 − F(x; ˆ θ)ntail Pr(ρ)

j = 1, . . . , n

50

slide-51
SLIDE 51

numerical estimation

  • 1. given observed event sizes, generate by drawing ,

uniformly at random, with replacement from the

  • bserved
  • 2. jointly estimate tail model’s parameter and on and

compute

  • 3. set
  • 4. repeat to produce (for confidence intervals, etc.)

n Y yj {xi} θ xmin Y ntail ρ = 1 − F(x; ˆ θ)ntail Pr(ρ)

j = 1, . . . , n

51

slide-52
SLIDE 52

numerical estimation

  • 1. given observed event sizes, generate by drawing ,

uniformly at random, with replacement from the

  • bserved
  • 2. jointly estimate tail model’s parameter and on and

compute

  • 3. set
  • 4. repeat to produce (for confidence intervals, etc.)

n Y yj {xi} θ xmin Y ntail ρ = 1 − F(x; ˆ θ)ntail Pr(ρ)

j = 1, . . . , n

52

slide-53
SLIDE 53

numerical estimation

  • 1. given observed event sizes, generate by drawing ,

uniformly at random, with replacement from the

  • bserved
  • 2. jointly estimate tail model’s parameter and on and

compute

  • 3. set
  • 4. repeat to produce (for confidence intervals, etc.)

if , event of size or greater is not statistically unlikely

n Y yj {xi} θ xmin Y ntail ρ = 1 − F(x; ˆ θ)ntail Pr(ρ)

j = 1, . . . , n hρi 0.01 x

53

slide-54
SLIDE 54

how well in practice?

  • generate synthetic data from power law

(when , )

  • draw events iid, contaminate with an event with
  • measure mean absolute error
  • measure mean ratio

Pr(x) ∝ x−α α < 2 Var(x) = ∞ h|ˆ ρ ρ|i hˆ ρ/ρi 1 n − 1 p = 0.001

54

slide-55
SLIDE 55

10

−4

10

−3

10

−2

10

−1

10 mean abs. err. sample size, n (tail) =2.0 =2.5 =3.0 40 400 4000 10

−2

10

−1

10 10

1

mean ratio − 1 sample size, n

how well in practice?

hˆ ρ/ρi 1 h|ˆ ρ ρ|i

55

slide-56
SLIDE 56

additional results

  • START Global Terrorism Database
  • MIPT-RAND, analysis by weapon used
  • MIPT-RAND, international events only
  • MIPT-RAND, OECD events only

56

slide-57
SLIDE 57

10 10

1

10

2

10

3

10

4

10

−5

10

−4

10

−3

10

−2

10

−1

10 Pr(X x) severity, x (deaths)

9/11

Global Terrorism Database power−law models

0.2 0.4 0.6 0.8 1 Pr(p)

ˆ ρ = 0.534 90% CI [0.115, 0.848]

57

slide-58
SLIDE 58

10 10

1

10

2

10

3

10

4

10

−5

10

−4

10

−3

10

−2

10

−1

10 Pr(X x) severity, x (deaths) chemical/biological power−law models

0.05 0.1 0.15 0.2 Pr(p)

10 10

1

10

2

10

3

10

4

10

−5

10

−4

10

−3

10

−2

10

−1

10 Pr(X x) severity, x (deaths) explosives power−law models

0.2 0.4 0.6 0.8 1 Pr(p)

10 10

1

10

2

10

3

10

4

10

−5

10

−4

10

−3

10

−2

10

−1

10 Pr(X x) severity, x (deaths) fire power−law models

0.1 0.2 0.3 0.4 0.5 Pr(p)

10 10

1

10

2

10

3

10

4

10

−5

10

−4

10

−3

10

−2

10

−1

10 Pr(X x) severity, x (deaths) firearms power−law models

0.1 0.2 0.3 0.4 0.5 Pr(p)

10 10

1

10

2

10

3

10

4

10

−5

10

−4

10

−3

10

−2

10

−1

10 Pr(X x) severity, x (deaths) knives power−law models

0.015 0.03 0.045 Pr(p)

10 10

1

10

2

10

3

10

4

10

−5

10

−4

10

−3

10

−2

10

−1

10 Pr(X x) severity, x (deaths)

  • ther/unknown

power−law models

0.1 0.2 0.3 0.4 0.5 Pr(p)

weapon type historical ˆ p 90% CI

  • chem. or bio.

0.023 [0.000, 0.085] explosives 0.374 [0.167, 0.766] fire 0.137 [0.012, 0.339] firearms 0.118 [0.015, 0.320] knives 0.009 [0.001, 0.021]

  • ther or unknown

0.055 [0.000, 0.236] any 0.564 [0.338, 0.839]

58

slide-59
SLIDE 59

10 10

1

10

2

10

3

10

4

10

−4

10

−3

10

−2

10

−1

10 Pr(X x) severity, x (deaths)

9/11

international events power−law models

0.2 0.4 0.6 0.8 1 Pr(p)

10 10

1

10

2

10

3

10

4

10

−3

10

−2

10

−1

10 Pr(X x) severity, x (deaths)

9/11

OECD events power−law models

0.03 0.06 0.09 Pr(p)

90% CI [0.010, 0.053] 90% CI [0.309, 0.610] ˆ ρ = 0.475 ˆ ρ = 0.028

59

slide-60
SLIDE 60

Deaths per million people, 1998-2007

  • <0.1
  • 0.1 - 1
  • 1 - 10
  • 10 - 100
  • 100 - 400

60

slide-61
SLIDE 61

international wars

  • CoW data

10 30 50 70 90

  • Cum. number of wars

Wars, x1000 Wars, x7061 1823 1853 1883 1913 1943 1973 2003 0.5 Year Pr(X7061)

61

slide-62
SLIDE 62

10

3

10

4

10

5

10

6

10

7

10

8

10

−2

10

−1

10 Pr(X x) x war severities power−law models

1.2 1.4 1.6 1.8 2 Pr()

international wars

  • CoW data
  • historical probability
  • future probability

(100 year)

ρ = 0.563 ρ = 0.411

62