
http://www.cs.ubc.ca/~tmm/courses/547-17F
Ch 7/10: Tables, Color Paper: D3
Tamara Munzner Department of Computer Science University of British Columbia
CPSC 547, Information Visualization Week 5: 10 October 2017
This Time
- paper: ArteryViz (carryforward from last time)
- chapters: Tables, Color
–some new material, not just backup slides
- paper: D3
–system context
- 3 shorter in-class exercises
–Two Numbers –Bars/Radial –Color Palettes
2
Next Time
- to read
–VAD Ch. 8: Arrange Spatial Data –VAD Ch. 9: Arrange Networks –paper: ABySS-Explorer: visualizing genome sequence assemblies.. Cydney B. Nielsen, Shaun D. Jackman, Inanc Birol, Steven J.M. Jones. TVCG 15(6):881-8, 2009 (Proc. InfoVis 2009).
- [paper type: design study]
–paper: Interactive Visualization of Genealogical Graphs. Michael J. McGuffin, Ravin
- Balakrishnan. Proc. InfoVis 2005, pp 17-24.
- [paper type: technique]
- to prepare
–project pitches (3 min each)
3
Ch 7: Arrange Tables
4 5
Encode Arrange Express Separate Order Align Use
VAD Ch 7: Arrange Tables
6
Encode Arrange Express Separate Order Align Use Manipulate Facet Reduce Change Select Navigate Juxtapose Partition Superimpose Filter Aggregate Embed
How? Encode Manipulate Facet
Map Color Motion Size, Angle, Curvature, ...
Hue Saturation Luminance
Shape
Direction, Rate, Frequency, ...
from categorical and ordered attributes
7
Encode Arrange Express Separate Order Align
Encode tables: Arrange space Arrange tables
8
Express Values Separate, Order, Align Regions Separate Order
1 Key 2 Keys 3 Keys Many Keys
List Recursive Subdivision Volume Matrix
Align Axis Orientation Layout Density Dense Space-Filling Rectilinear Parallel Radial
9
Keys and values
- key
–independent attribute –used as unique index to look up items –simple tables: 1 key –multidimensional tables: multiple keys
- value
–dependent attribute, value of cell
- classify arrangements by key count
–0, 1, 2, many...
1 Key 2 Keys 3 Keys Many Keys
List Recursive Subdivision Volume Matrix
Express Values Tables
Attributes (columns) Items (rows) Cell containing value
Multidimensional Table
Value in cell
Idiom: scatterplot
- express values
–quantitative attributes
- no keys, only values
–data
- 2 quant attribs
–mark: points –channels
- horiz + vert position
–tasks
- find trends, outliers, distribution, correlation, clusters
–scalability
- hundreds of items
10
[A layered grammar of graphics.
- Wickham. Journ. Computational and Graphical Statistics 19:1 (2010), 3–28.]
Express Values
Some keys: Categorical regions
- regions: contiguous bounded areas distinct from each other
–using space to separate (proximity) –following expressiveness principle for categorical attributes
- use ordered attribute to order and align regions
11
1 Key 2 Keys 3 Keys Many Keys
List Recursive Subdivision Volume Matrix
Separate Order Align
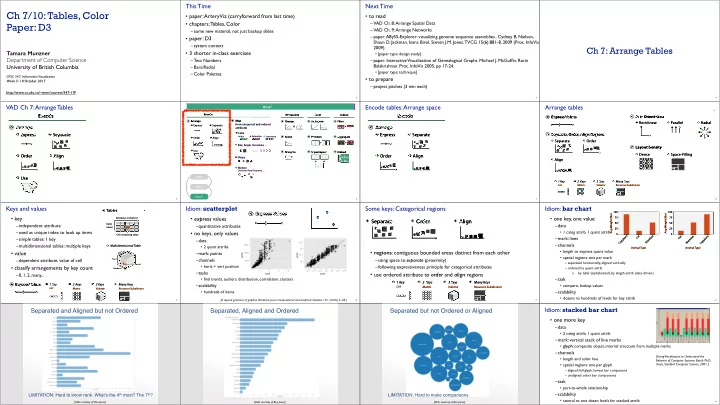
Idiom: bar chart
- one key, one value
–data
- 1 categ attrib, 1 quant attrib
–mark: lines –channels
- length to express quant value
- spatial regions: one per mark
– separated horizontally, aligned vertically – ordered by quant attrib » by label (alphabetical), by length attrib (data-driven)
–task
- compare, lookup values
–scalability
- dozens to hundreds of levels for key attrib
12
100 75 50 25 Animal Type 100 75 50 25 Animal Type
Separated and Aligned but not Ordered
LIMITATION: Hard to know rank. What’s the 4th most? The 7th?
[Slide courtesy of Ben Jones]
Separated, Aligned and Ordered
[Slide courtesy of Ben Jones]
Separated but not Ordered or Aligned
LIMITATION: Hard to make comparisons
[Slide courtesy of Ben Jones]
Idiom: stacked bar chart
- one more key
–data
- 2 categ attrib, 1 quant attrib
–mark: vertical stack of line marks
- glyph: composite object, internal structure from multiple marks
–channels
- length and color hue
- spatial regions: one per glyph
– aligned: full glyph, lowest bar component – unaligned: other bar components
–task
- part-to-whole relationship
–scalability
- several to one dozen levels for stacked attrib
16
[Using Visualization to Understand the Behavior of Computer Systems. Bosch. Ph.D. thesis, Stanford Computer Science, 2001.]