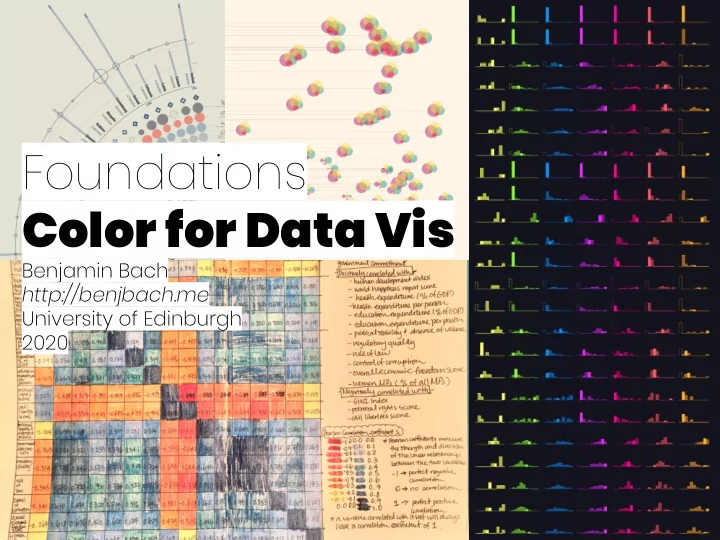

Foundations Color for Data Vis Benjamin Bach http://benjbach.me University of Edinburgh 2020
Outline What is color? Color in visualization Color Scales Sequential, diverging, categorical scales Rainbow color map Color blindness
What is Color?
~120 million rods 400-700nm ~6 million cones
Color Models Subtractive Additive Models Models
What is color?
HSB Model: Hue, Saturation, Brightness Color = (Brightness/Lightness, Saturation, Hue)
HSB Color Picker
Color in Visualization
Visual Variables
http://innovis.cpsc.ucalgary.ca/innovis/uploads/Publications/Publications/Carpendale_visual_variables.pdf
Color Scales
More examples of color scales (ColorBrewer)
Colorbrewer.org
Sequential Scales
More examples of color scales (ColorBrewer)
Sequential color scales Single hue: Multi hue: https://github.com/d3/d3-scale-chromatic
Mapping color scales Linear Data value Non-linear Stepwise
Median Median
Median Median
10% 8 18
10%
Diverging Scales
More examples of color scales (ColorBrewer)
Diverging color scale Multi hue:
Categorical Scales
More examples of color scales (ColorBrewer)
I Want Hue
Rainbow Color Maps
More examples of color scales (ColorBrewer)
http://innovis.cpsc.ucalgary.ca/innovis/uploads/Publications/Publications/Carpendale_visual_variables.pdf
Color Maps Rainbow: Diverging:
Rainbow Colormap
Rainbow Colormap
Color (mis)use
Lightness perception of rainbow color maps
Rainbow colormap Pros: - Many different values - Compare similar values Cons: - Colors hardly orderable - Introduces sharp jumps in values - Hides overall patterns - Overemphasizes certain values - Is not black/white nor colorblind save!
Linear Rainbow map
Color Blindness
Normal vison Deuteranopia Protanopia Tritanopia
Protanopia Deuteranopia Tritanopia "If a submitted manuscript 8% happens to go to three male reviewers of Northern European descent, the 0.5% chance that at least one will be color blind is 22 percent ."
www.color-blindness.com Normal Types of color blindness
Colorblind safe palettes Colorbrewer.org: Diverging Sequential Categorical
Redundant encoding
Further applications in DataVis
Meaning of colors across cultures
Take home messages: ● Color = hue + lightness + saturation ● Chose a color scale that fits your data ● Avoid rainbow color palettes ● Test your color palettes for colorblindness ● Whatever increases accessibility for some fraction of the population, increases accessibilty overall.
Further reading Wong, Bang. "Points of view: Color blindness." (2011): 441. ● Tamara Munzner: Visualization Analysis and Design, 2016; ● Chapter 10: Map Color and Other Channels https://www.color-blindness.com/types-of-color-blindness ● Colin Ware: Information Visualization—Perception for Design, ● 2012
Recommend
More recommend