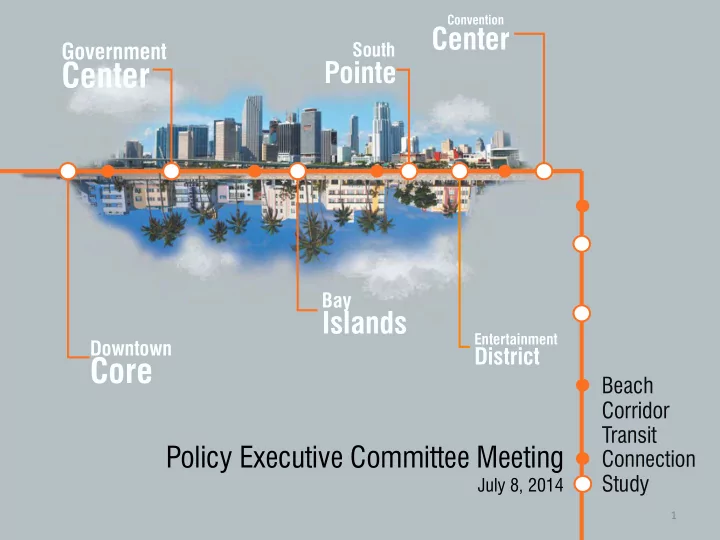
Center Pointe Bay Islands Entertainment Downtown District Core Beach - - PowerPoint PPT Presentation

center
SMART_READER_LITE
LIVE PREVIEW

Center Pointe Bay Islands Entertainment Downtown District Core Beach - - PowerPoint PPT Presentation

Convention Center Government South Center Pointe Bay Islands Entertainment Downtown District Core Beach Corridor Transit Policy Executive Committee Meeting Connection Study July 8, 2014 1 PURPOSE OF MEETING 2 New Miami Beach Hybrid


slide-1
SLIDE 1

Downtown

Core

Government

Center

Bay

Islands

South

Pointe

Entertainment

District

Convention

Center

Beach Corridor Transit Connection Study

Policy Executive Committee Meeting

July 8, 2014

1

slide-2
SLIDE 2

2

PURPOSE OF MEETING

slide-3
SLIDE 3

3

 New Miami Beach “Hybrid” Option  Off-wire Technology Assessment  Financial Analysis Results  TIGER Planning Grant Status

Nice

slide-4
SLIDE 4

4

BEACH HYBRID ALIGNMENT OPTION

slide-5
SLIDE 5

5

Beach Hybrid

Alignment Option

Derived from TSC Members More Frequent Service in South Beach Duplicative Bus Service Eliminated Potential Bus O&M Cost Savings Circulation on East & West Sides

slide-6
SLIDE 6

6

Beach Hybrid

Alignment Option

Capital ital and O&M Cost st Summary mary

2004 04 LPA DC DC OLA Hybrid Extens ensions ions Capital al Cost $774 74 M $532 32 M $646 46 M $694 94 M $529 29 M Annual O& O&M Cost $45 5 M $22 2 M $34 4 M $49 9 M* $28 8 M * 5 Min peak and o

  • ff-peak

eak headwa ways ys both segmen ents

slide-7
SLIDE 7

7

TECHNOLOGY ASSESSMENT

slide-8
SLIDE 8

8

 400+ streetcar/tram/LRT systems

worldwide, (8,000+ low-floor vehicles)

 US is only a small portion of the

global marketplace for rail transit equipment

 Streetcar/tram vehicle market

has evolved considerably since 2000

 Power supply technology still

developing

Nice Dallas

slide-9
SLIDE 9

9

 Aesthetic concerns - e.g. historic district  Route optimization - solution to a specific problem

(impaired clearance, narrow right-of-way, utility conflict, etc.)

 Cost? (difficult to know with certainty)

Overhead wire visual impact can be minimized

Angers Reims Bergen, NJ Reims

slide-10
SLIDE 10

Speaking the Same Language

slide-11
SLIDE 11

11

  • Power supply replaced overhead wire
  • Segmented power supply turns on only

when vehicle is over it

  • Proprietary infrastructure and vehicle

equipment

  • Significant underground infrastructure
  • Complicates track design
  • Typically used for a portion of system

(first full system now under construction)

  • Continuous vs. blended approach,

inductive variant

slide-12
SLIDE 12

12

Under Contract:

  • Beijing, China (5.8 miles) Breda

Under Construction:

  • Dubai, UAE (6.2 miles 2014) Alstom
  • Zhuhai, China (5.4 miles 2016) Breda
  • Cuenca, Ecuador (portion of 6.5 mile line, 2016) Alstom

Revenue Service:

  • Bordeaux (8 mile portion, 2007) Alstom
  • Angers (0.9 mile portion, 2011) Alstom
  • Reims (1.25 mile portion, 2011) Alstom
  • Orleans (1.25 mile portion, 2012) Alstom
  • Tours (1.1 mile portion, 2013) Alstom

Orleans Angers

slide-13
SLIDE 13

13

 Vehicles use external power supply or on-

board energy storage (OESS)

 Batteries and Super Caps most common

energy storage technologies

 Off-wire “range” dependent on operating

conditions and OESS capacity

 New technology evolving rapidly  Energy (battery) storage devices have

limited life

 Weight added to vehicle; increased energy

consumption

 Reduced acceleration rate, reduced AC

Nice Seville

slide-14
SLIDE 14

14

Planned:

  • 2016 Detroit (portions)
  • 2017 Ft. Lauderdale (segment)
  • ? Washington, DC (portion)
  • ? Budapest, Hungary (portion)
  • ? Konya, Turkey (1.1 mile segment of 3.2 mile line)

Under Construction:

  • 2014 Seattle (one direction of new 2.5 mile line)
  • 2014 Dallas (2 vehicles, 1 mile of 1.6 mile line)
  • 2014 Kaohsiung, Taiwan (13.7 mile line, charging at stops)
  • 2014 Guangzhou, China (4.8 mile line, charging at stops)
  • 2015 Nanjing, China (10.6 miles, some overhead)
  • 2015 Doha, Qatar (7.2 miles, charging at stops)

Dallas

slide-15
SLIDE 15

15

Revenue Service:

  • 2007 Nice, France. 0.6 of 5.5 mile line
  • 2011 Seville, Spain. 0.4 of 1.4 mile line
  • 2011 Zaragoza, Spain. 1.25 of 8 mile line
  • 2013 Shenyang, China. Portion of new system

Nice

Zaragoza Nice

slide-16
SLIDE 16

16

 E.g. hydrogen fuel cells or diesel generator  Significantly less progress compared to ground

power supply and onboard energy storage

 Fuel cells still in prototype phase  Some notable but limited applications of diesel

generators

FEVE Hydrogen tram prototype Nordhausen; Siemens Combino DUO

slide-17
SLIDE 17

17

South Korean prototype battery tram

Off-wire O&M savings:

 Less overhead wire to maintain  Reduces conflicts with other users of the right-

  • f-way

Off-wire O&M added costs:

 Replacement /disposal of batteries  Additional maintenance costs:  Batteries, additional subsystem complexity  Additional maintenance hazards  Current collector (e.g. pantograph) cycles  Proprietary parts issues  “New Technology” unknowns

Variables:

 Technology employed  Length of off-wire section  Duty cycle

slide-18
SLIDE 18

Ground Power Supply Onboard Energy Storage Carbuilder Prototype Under Contract Revenue Service Prototype Under Contract Revenue Service Alstom * X X X X Bombardier * X Brazil- Bom Sinal In devmt. Breda * X X Brookville * X CAF * X X China- CSR X China- CNR Changchun X Hyundai Rotem / KRRI * X Inekon X Kawasaki * X Kinkisharyo * X RTRI Japan X Siemens * X X Skoda X X Stadler X United Streetcar * Vossloh X

18 * Have delivered Buy-America compliant vehicles

slide-19
SLIDE 19

19

 Duty Cycle

 Stops per mile (mixed traffic vs. exclusive

guideway)

 Grades  Climate (HVAC)

 Vehicle length and weight  Exclusive guideway opportunities  Utility impacts  Full off-wire; or only partial?

 At 6.75 miles Miami “DC” option would be

among the longer off-wire systems

 Time under wire is time spent charging  Some wire provides flexibility to optimize the

amount of on-board energy storage

 Marketplace might still respond with a fully

  • ff-wire solution

Shenyang Seville

slide-20
SLIDE 20

20

 Don’t define the solution--define the need and let the

marketplace propose solutions

 Define the business case for off-wire; understand cost/benefit  Being an early adopter of a new technology has risks  Mitigate by using project delivery that shares that risk  Ground power supply not a good match to flood-prone areas  Stay flexible; partially wired system has important advantages  Reduce energy demand; keep vehicles out of mixed traffic  Use longer vehicles (~98 ft); more room for OESS, greater

future passenger capacity

slide-21
SLIDE 21

21

FINANCIAL ANALYSIS

slide-22
SLIDE 22

Financial Analysis

Project is enabled by:

Funding & Finance Strategy Revenue Sources for CapEx & OpEx Alternative Delivery Mechan- isms Partnerships (e.g., P3; TOD)

22

slide-23
SLIDE 23
  • f CapEx and Opex

$2013 in millions of dollars for total capital cost estimate. Source: Gannett Fleming, 2014.

23

2004 04 LPA DC DC OLA Extens ensions ions Capital al Cost $774 74 M $532 32 M $646 46 M $529 29 M Annual O&M Cost $45 5 M $22 2 M $34 4 M $28 8 M

Cost Framework: Initial Estimates

slide-24
SLIDE 24

Funding Questions

24

  • 1. Should the project be funded with a

corridor-specific source?

  • 2. Should Federal New Starts funds be

applied?

  • 3. What funding mechanisms are viable

for this project?

  • 4. What is the potential for new tolls?
  • 5. What is the potential for value capture?
  • 6. What are the benefits and real
  • pportunities for P3?
slide-25
SLIDE 25
  • 1. Should the project be funded with a

corridor-specific source?

25

  • Probably yes
  • No county-wide source available
  • Benefits are localized to Miami and Miami

Beach travel market and development

  • Self-sufficient and viable corridor-specific

funding sources are available

  • Avoids county-wide prioritization process
slide-26
SLIDE 26
  • 2. Should Federal New Starts funds be

applied?

26

  • If County and Cities commit to local, dedicated

funding, then answer is “no”

  • Complicated process, competitive, and over-

prescribed

  • Constrains flexibility in procurement
  • pportunities, especially for P3
  • Adds 2+ years to the opening day
  • Forego potentially ~$200M capital dollars
  • Viable mix of non-Federal funding sources are

available to cover full project costs

slide-27
SLIDE 27
  • 3. What funding mechanisms are viable

for this project?

27

  • Numerous sources identified for capital and

O&M costs.

  • Several sources could fund project in its

entirety.

  • Two seem most promising.
slide-28
SLIDE 28

Funding & Financing Landscape

Operating Revenues Capital Revenues

Passenger Fare Revenue Traditional/Existing Sources

  • FHWA CMAQ operating (3 yr limit)
  • Dept. of Public Works (DPW)
  • 6 cent LOGT
  • County Gas Tax
  • 9th cent Gas Tax
  • MDT
  • Direct Operating Revs.
  • Fed/State Grants incl. FDOT

Transit

  • PTP Surtax (operations)

Innovative/New Sources

  • Advertising (pillars/kiosks) and

marketing; naming rights

  • Right-of-Way / Air rights
  • Digital Ecosystem
  • Station revenues
  • Concessions (travel retail; food;

ATMs)

  • FL State Energy Program (SEP)

Traditional/Existing Sources

  • Federal grants:
  • TIGER (8th or 9th cycle)
  • FTA New Starts Capital
  • TA Formula Grants
  • Real Property Ad Valorem Tax
  • Local Option Gas Tax (LOGT)
  • County Option Sales Tax Surtax
  • Local Gov Infrastruc Sales Surtax
  • HEFT/MDX Toll Revenue Share
  • DDA or County transp fees
  • FDOT transit funding
  • PTP Surcharge
  • County General Funds

Innovative/New Sources

  • TOD/joint development
  • Special assessment districts
  • Tax increment districts (TIFD)
  • Tourist and Convention Devel.
  • Parking surcharge
  • Vehicle Miles Traveled (VMT)
  • Partner agencies (e.g., CRAs)
  • Causeway (2) Tolling

Financing Mechanism

Traditional/Existing

  • Debt and GO Bonds

Alternative Delivery & Innovative Mechanisms

  • Florida (FDOT) SIB loans
  • Tax credit bonds
  • TIFIA
  • P3 mechanisms
  • Availability payments
  • Private activity bonds (PAB)
  • Private equity

28

slide-29
SLIDE 29
  • 4. What is the potential for new tolls?

29

  • Projected annual yield of ~$75 -- $150

million/year (2014$) combined on both Causeways.

  • Range assumes $1 toll and $2 toll,

respectively

  • USDOT procedures for Interstates (e.g., I-395)

constrains, but could be modified. USDOT considering eliminating the prohibition.

slide-30
SLIDE 30
  • 5. What is the potential for value

capture?

30

  • Tax Increment Financing yield: $18 million/year
  • Special Assessment District yield: $12

million/year

  • 1% local option surtax to the Tourist and

Convention Development Tax yield: $10 million/year

  • Total: ~$40 million/year
slide-31
SLIDE 31
  • 6. What are the benefits and real
  • pportunities for P3?

31

  • Expedited and efficient project delivery:
  • Saves time and money
  • Allocates risks to parties best able to

manage

  • Miami-Dade region is national leader in

successful P3 projects.

  • National best practices in P3 streetcar systems

demonstrate effectiveness. (e.g., Portland Streetcar; Denver RTD Eagle Project).

slide-32
SLIDE 32

Alternate Delivery Mechanisms:

Project Implementation Techniques

Degree of Private Sector Involvement Degree of Private Sector Risk

Design – Build – Finance – Maintain -- Availability Payments Design – Build – Finance –Operate – Maintain: Availability Payments Design – Build – Finance –Operate – Maintain: Tolls with Revenue Risk (generally, highway only) Traditional Model Alternate Delivery/ Public Financing Concession Agreement/ Private Financing Design – Build – Finance Design – Build – Operate - Maintain Design - Build Design - Bid - Build

32

slide-33
SLIDE 33

Typical P3 Business Model

Special Purpose Vehicle Concessionaire Lenders Sponsors Miami-Miami Beach

Lead Entity

Design-Build Consortium O &/or M

Concession Agreement Credit & Security Documents Formation Documents D&B Documents O&M Documents

Single point responsibility for project implementation Need for coordination with Operator during design and commissioning

33

slide-34
SLIDE 34

Benefit of P3: Value for Money

Drivers of Savings:

  • Optimal allocation of risks
  • Innovation: design and

construction efficiencies

  • Focus on life cycle costs
  • Integrated planning and

design

  • Single point responsibility

for management and control

A: Base Costs B: Financing Costs C: Retained Risks D: Ancillary Costs A: Base Costs B: Financing Costs C: Retained Risks D: Ancillary Costs

Value for Money Public Sector Comparator (D-B-B) Adjusted Shadow Bid

34

slide-35
SLIDE 35

Alternative Project Delivery Typical Risk Allocations

35

slide-36
SLIDE 36

North America P3 Projects

36

slide-37
SLIDE 37

Denver RTD Eagle P3 Project

Project Description

  • Gold Line Corridor: 11.2-mile rail transit corridor from

Denver Union Station to the vicinity of Ward Road

  • East Corridor: 22.8-mile commuter rail transit between

Denver Union Station and Denver International Airport

  • North Metro Corridor: 18-mile rail link between Denver

Union Station and 162nd Ave

  • Maintenance Facility

37

slide-38
SLIDE 38

Denver RTD Eagle P3 Project

Concessionaire – Denver Transit Partners

  • Macquarie (90%) - sold to Uberior and John Laing
  • Fluor (10%)
  • Design Build Contractors:

‒Fluor – 50% of the EPC & 33% of the O&M ‒Balfour Beatty - 50% of EPC and 33% of O&M ‒HYUNDAI -Rotem (USA) – rail vehicles ‒Ames Construction ‒HDR – engineering

38

slide-39
SLIDE 39

Denver RTD Eagle P3 Project

Financial Details

  • 46 year concession reduced by mutual agreement to 34 years
  • Lifecycle cost reduced by $817.5m (2010$) by 12 yr reduction in

term of concession

  • Total Investment: $1.6bn (Phase 1)
  • FTA New Starts Grant: $1.0bn
  • Private Equity:

$ 50.4m – Superior: $ 24.5m (45%) – Laing: $ 24.5m (45%) – Fluor: $ 5.4m (10%)

  • PABs: $398m
  • RTD Bridge Financing: $142m (includes $44m of service

payments for early completion)

39

slide-40
SLIDE 40

Denver RTD Eagle P3 Project

Benefits of P3

  • Cost Savings - $300 million less than the RTD cost

estimate

  • Faster delivery – delivery scheduled 11 months in

advance of RTD’s deadline

  • Transfer of certain construction risks and O&M risks

from RTD to P3 concessionaire

40

slide-41
SLIDE 41

Alternative Project Delivery: Benefits for this Project

  • Risk sharing (or transfer)
  • Accelerated project delivery (time) and cost

certainty

  • Contractor/engineer innovation
  • Life-cycle cost efficiencies
  • Increased leverage of existing revenue streams
  • Negotiation, partnership, collaboration

41

slide-42
SLIDE 42

Conclusions and Next Steps

  • Need dedicated, available and stable funding

source(s), not just a portion of revenues.

  • Several funding options are promising; some with

lead time or enabling legislation

  • Add project into transit project development

programming (TDP and TIP).

  • Prioritize transportation investment utilizing

latent capacity in existing funding sources and new local revenues.

  • Checklist of “readiness” steps for P3.

42

slide-43
SLIDE 43

DID WE ADDRESS ALL QUESTIONS?

Is a partially wired system acceptable? Should the project be funded with corridor-specific funding sources? Should we pursue Federal New Starts funding? Should we further explore tolling the two Causeways? Should we further explore value capture funding mechanisms? Should we further explore a P3 arrangement? Should we amend the LRTP to include this project? Should the Miami Beach Hybrid Option be considered in the first phase, or a later phase?

43

slide-44
SLIDE 44

44

TIGER PLANNING GRANT STATUS

slide-45
SLIDE 45

Tiger Grant Summary

  • Notice of Funding Availability (NOFA) announced

February 25th, 2014

  • $35M available for planning projects
  • TIGER grant submitted on April 26th, 2014
  • Requested $1.5M (50% of anticipated project cost)
  • Expect response by September/October 2014

45

slide-46
SLIDE 46

Options for Funding Next Phase

Option 1 Option 2 Option 3

  • TIGER $ 1,500,000 $ 0
  • FDOT $ 750,000 $ 1,500,000

?

  • MDT $ 250,000 $ 500,000

?

  • Miami $ 250,000 $ 500,000

?

  • Miami $ 250,000 $ 500,000

? Beach $ 3,000,000 $ 3,000,000

46

slide-47
SLIDE 47

Next PEC Meeting

Date

DATE: October 2, 2014, 2:00 pm

47

TIME: 2:00 pm – 3:00 PM AGENDA:

  • Maintenance Facility Locations
  • Tiger Planning Grant Update
  • Implementation Plan/Next Steps

LOCATION: TBD