
SLIDE 1
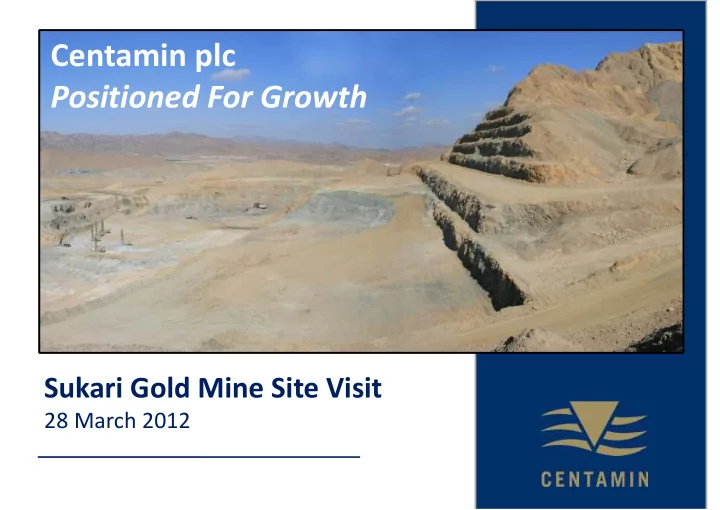
Centamin plc Positioned For Growth Sukari Gold Mine Site Visit 28 - - PowerPoint PPT Presentation
Centamin plc Positioned For Growth Sukari Gold Mine Site Visit 28 March 2012 2 Forward Looking Statements There are risks associated with an investment in the shares of Centamin. Recipients of this presentation should review the risk factors
2
There are risks associated with an investment in the shares of Centamin. Recipients of this presentation should review the risk factors and other disclosures regarding Centamin contained in the preliminary prospectus of Centamin that has been filed with Canadian securities regulators and available at www.sedar.com. This presentation contains "forward-looking information" (also referred to as "forward-looking statements") which may include, but are not limited to, statements with respect to the future financial or operating performance of the Company, its subsidiaries and its projects (including the Sukari Project), the future price of gold, the estimation of mineral reserves and resources, the realization of mineral reserve estimates, the timing and amount of estimated future production, revenues, margins, costs of production, capital, operating and exploration expenditures, costs and timing of the development of new deposits, costs and timing of construction, costs and timing of future exploration, the timing for delivery of plant and equipment, requirements for additional capital, foreign exchange risk, government regulation of mining and exploration operations, environmental risks, reclamation expenses, title disputes or claims, insurance coverage and the timing and possible outcome of pending litigation and regulatory matters. Often, but not always, forward- looking statements can be identified by the use of words such as "plans", "hopes", "expects", "is expected", "budget", "scheduled", "estimates", "forecasts", "intends", "anticipates", or "believes" or variations (including negative variations) of such words and phrases, or state that certain actions, events or results "may", "could", "would", "might" or "will" be taken, occur or be achieved. Forward-looking information involves and is subject to known and unknown risks, uncertainties and other factors which may cause the actual results, performance or achievements of the Company and/or its subsidiaries to be materially different from any future results, performance or achievements expressed or implied by the forward-looking information. Such factors include, among others, general business, economic, competitive, political and social uncertainties; the actual results of current exploration activities and feasibility studies; assumptions in economic evaluations which prove to be inaccurate; fluctuations in the value of the United States dollar and the Canadian dollar relative to each other and to the Australian dollar; future prices of gold and
disputes or slow downs and other risks of the mining industry; climatic conditions; political instability, insurrection or war; arbitrary decisions by governmental authorities; delays in obtaining governmental approvals or financing or in the completion of development or construction activities. Discovery
Although the Company has attempted to identify important factors that could cause actual actions, events or results to differ materially from those described in forward-looking information, there may be other factors that cause actions, events or results to differ from those anticipated, estimated or
forward-looking information, whether as a result of new information, future events or results or otherwise. There can be no assurance that forward-looking information or statements will prove to be accurate, as actual results and future events could differ materially from those anticipated in such information or
3
4
– FY2011 production: 202,698 ounces at $556/oz – 2012 guidance: 250,000oz at approx. $550/oz – Targeting 500,000oz/annum production rate
– Ramping up to consistent capacity of 5Mtpa and expansion to 10Mtpa progressing well – Underground mine continuing to perform strongly
– Sukari Gold Project: 15.5Moz resources / 10.1Moz reserves and growing – Positive drilling results from regional exploration – Strategic entry into other parts of Arabian-Nubian shield
– c.US$200m cash (as at 31 December 2011) – Highly cash generative with no debt or hedging
5
– Focused on FY2012 production target and maintaining tight control on cash costs
– Ramp up construction effort on Stage 4 – Commissioning expected to begin in Q1 2013
– Accelerate access to higher grade ore zones at depth to further enhance long term underground production – Underground production of 300-350,000 tonnes in 2012, ramping up to 500,000tpa and beyond
– Continue regional exploration programme – Commence exploration programme in Ethiopia at Sheba properties
6
Resources and Reserves 15.5Moz / 10.1Moz* Production 2010: 150,289oz 2011: 202,968oz Targeting 500,000oz/annum Life of Mine 20 years Cash Costs 2011: US$556/oz 2012 forecast: Approx. $550/oz Headgrade of OP ore to mill in 2012 Q1: 1.0-1.2g/t Q2: 1.3-1.5g/t Q3 and Q4: 1.5-1.7g/t Headgrade of blended ore processed in 2012 1.8-2.2g/t
eastern desert of Egypt – 700km from Cairo – 25km from Red Sea
licence granted in 2005 plus option to extend for a further 30 years
agreement with Egyptian government: – No taxes and duties for 15 years and
– 3% royalty rate – Full cost recovery prior to 50% profit sharing
FY2012 whilst maintaining low cash costs
*10.1Moz Reserves, 13.13Moz Measured and Indicated Resources and 2.3Moz Inferred Resources
7
Q3 2011
Q4 2010
Q4 2011
8
Highly cash generative and growth strategy fully financed Cash Generation US$54.9m EBITDA
(3 months to 31 Dec 2011)
Cash Balance c.US$200m cash
(as at 31 Dec 2011)
Debt and Hedge Free 100% exposure to high gold price Stage 4 capex: US$287m Selective M&A Sustaining capex: US$20-30m 2012 Exploration: US$13-15m UG capex: US$18m
9
PROJECT YEAR Units 2012 2013 2014 2015 2016 OPEN PIT MINE PRODUCTION Ore t 9,063,320 11,267,856 4,412,209 9,007,943 19,584,848 Waste t 20,817,141 33,018,969 64,230,025 60,492,318 48,392,285 Total t 29,880,462 44,286,825 68,642,233 69,500,261 67,977,133 Strip Ratio W:O 2.30 2.93 14.56 6.72 2.47 Head grade of mined ore (> 0.4 g/t) g/t 1.08 0.96 0.74 0.79 1.19 Insitu ounces
314,113 348,505 104,389 230,186 750,188 UNDERGROUND MINE PRODUCTION Development ore t 181,660 235,121 Production ore t 168,470 264,959 500,080 500,080 500,080 Total t 350,130 500,080 500,080 500,080 500,080 Waste Tonnes t 130,637 107,814
g/t 9.65 9.17 8.74 8.74 8.74 Insitu ounces
108,650 147,508 140,521 140,521 140,521 Overall Mined Ounces
422,763 496,012 244,910 370,707 890,709 MILL PRODUCTION Underground t 350,130 500,080 500,080 500,080 500,080 Open Pit t 4,150,275 5,601,188 7,549,868 8,486,233 9,042,070 Total t 4,500,405 6,101,268 8,049,948 8,986,313 9,542,150 MILL PROCESSING GRADES Open Pit g/t 1.46 1.52 0.79 0.80 1.62 Underground g/t 9.65 9.10 8.74 8.74 8.74 HEAP LEACH PRODUCTION Leach quantity t 443,120 1,368,556 3,600,000 710,507 1,080,576 Grade g/t 0.60 0.63 0.72 0.59 0.64 GOLD PRODUCTION Open Pit
194,743 273,029 192,447 217,260 471,384 Underground
108,650 146,318 140,521 140,521 140,521 Dump Leach
11,767 10,998 8,038 5,272 7,321 Recovery % 85.9% 84.8% 84.7% 86.1% 86.6% Total Gold Production
272,505 366,525 290,110 313,176 537,420
10
remove entire hill
20 year mine life
within ultimate pit design
the largest highwall, extracting in total 1800Mt
11
Development Schedule 2011 23Mtpa 2012 30Mtpa 2013 44Mtpa 2014-2016 68Mtpa 2017
74Mtpa
12
@ 10.4g/t)
1.1Mt @ 16.3g/t with definition drilling ongoing
drilling programme down dip of Amun and to the north
secondary decline commenced: October 2011
13
14
production ounces
2011
15
16
Sukari - into the wider Arabian-Nubian shield
licence – Sukari regional exploration
reserve of 1.1Mt @ 16.3g/t
2000 to 13.13Moz M&I, 2.3Moz Inferred today
drilling results from Quartz Ridge and V Shear
entry into Ethiopia
through targeted acquisitions
17
resources
Measured & Indicated, 2.3Moz Inferred and reserves of 10.1Moz
16.3g/t (approx. 600,000oz)
— Drilling with modified inclined diamond rig continues on northern section of Sukari hill in previously inaccessible areas — Targeting new resource ounces — Second ‘incline’ rig to be added in Q1 2012
based resource and exploration diamond drilling will target the Sukari orebody at depth
18
besides Sukari hill
Shear
truckable to existing plant
19
mineralising trend on Sukari tenement area that is being systematically investigated by the Sukari Exploration Team
drilling programme defines continuous mineralised structure over 150m strike length
― 22m @ 1.11 g/t from surface ― 11m @1.08 g/t from 58m ― 5m @ 2.04 g/t from 31m ― 4m @ 26.27 g/t from 156m
currently
20
September 2011
as follows: 10m @ 4.71 g/t (from 151m) 28m @ 2.98 g/t (from 11m) 4m @ 100.7 g/t (from 30m)
potential to act as a relatively high grade satellite pit to the Sukari open pit
21
Tulu Kapi Asmara Al Hajar Jabal Sayid Mahd ad Dahab Sukhaybarat Bulghan Sukari Hassai Zara Bisha Al Amar
mining region, particularly for precious metals
exploration in the region using modern techniques
been developed here, including:
Country Company Project Name Au Resources / Reserves 2011 Production
Eritrea Nevsun Resources Bisha 1.78Moz 379,000oz Saudi Arabia Ma’aden 5 projects (primary mine is Mahd ad Dahab ) 10.1Moz / 1.3Moz c.140,000oz Sudan La Mancha Hassai 10.4Moz / 1.1Moz 71,730oz Ethiopia Nyota Minerals Tulu Kapi 1.46Moz (resources only)
Sunridge Gold Corp Asmara 1.14Moz (resources only)
Chalice Gold Zara 0.84Moz / 0.76Moz
Arabia Barrick Gold Corp Jabal Sayid 0.3Moz (resources only)
22
Acquisition of Sheba
growth strategy into other countries in the Arabian-Nubian shield
value to the Sheba properties through exploration and development
area of Ethiopia – drilling to begin in Q1 2012
23
― Corporate tax of 35% - negotiable breaks and holidays ― Royalty of 8% at discretion of the Minister
― Demonstrates government’s support for mining industry ― 5% government free-carried interest in mining projects ― Exemption from customs duties, carry forward on losses for 10 years
― Democratic government since 1991 ― Prime Minister Meles Zenawi won a fourth term in elections held in May 2010
― 2011E GDP growth: 9%
― Historically underexplored ― Emerging gold mining industry with significant artisanal gold mining activities
24
Una Deriam: 95km2 / 100% ownership 10 km long soil/rock chip gold anomaly Finarwa: 71km2 / 100 ownership Recent artisanal activity supported by strong soil anomalies associated with strong NNE shear zone Additional soil/rock chip sampling programme and structural mapping required to make this target drill ready Winibo: 39km2 / 100% ownership 4km copper anomaly in a strong alteration zone Shehagne: 29km2 / subject to a letter of intent with Stratex Currently being reviewed by Centamin Diamond drilling programme recently completed, awaiting results
25
significant +20m Au intersections
26
27
28
alongside the existing plant
complete
US$52.6m expenditure as at end of Dec 2011
― SAG mill ― Ball mill ― Re-grind mills ― Electrical items ― 35MW power station
the power station and TSF continued in Q4
to begin in Q1 2013
29
Plant Automation
thus optimising leach conditions on a continual basis Carbon Management
helps to maintain a higher amount of gold adsorbed onto carbon and recovered
30
Activity
Q1 2012 Q2 2012 Q3 2012 Q4 2012 Q1 2013 Q2 2013 Q3 2013 Q4 2013
Expansion of Sukari Construction of Stage 4 Stage 4 commissioning Construction of Ptah Decline Exploration Sukari resource update Sukari regional exploration results Drilling at Una Deriam, Ethiopia
31
Production Growth
Resource Growth
Growth Beyond Sukari
beyond
Strong Financial Position and Experienced Management Team
32
CONTACT US Josef El-Raghy, Chairman Katharine Sutton, Head of Investor Relations +44 (0) 20 569 1670 katharine.sutton@centamin.com
33
34
Shares Issued: 1,096,297,381 Share Price: 74.75p Market Capitalisation: £818m Markets: London Stock Exchange (CEY) Toronto Stock Exchange (CEE) Listing Information 3 Year Share Price Performance Significant Shareholders
*as at 23 March 2012 Graph: London Stock Exchange
Management 6.5% Fidelity 6% Franklin Advisors 5% LGIM 5% Threadneedle 4.75% Barings 4.75% Acuity 4.5% Kames (AEGON) 4%
35
June 2012
since signing in 1994 – enshrined as Law 222 by National Assembly
Nubian Shield
existing infrastructure, industry wide subsidies on fuel
further 15 years / 3% royalty
investment / mining friendly
36
"#"$
"#"$ %"%#& !'
Terms of the Concession Agreement:
sharing over a minimum period of 3 years Capex spent to date:
production
Capex still to come:
4: US$234.4m (excluding contingency)
37
Sukari Global Resource Sukari Mineral Reserve
Measured Indicated Total Measured + Indicated Inferred Cut-off Tonnes Grade Tonnes Grade Tonnes Grade Gold Tonnes Grade Gold g/t Au (Mt) (g/t Au) (Mt) (g/t Au) (Mt) (g/t Au) (Moz) (Mt) (g/t Au) (Moz) 0.3 150.04 1.00 238.90 1.08 388.9 1.05 13.13 66.0 1.1 2.3 0.4 120.72 1.16 196.27 1.23 317.0 1.21 12.33 53.0 1.2 2.0 0.5 98.72 1.32 164.85 1.38 263.6 1.36 11.53 43.3 1.4 1.9 0.7 69.57 1.63 120.81 1.67 190.4 1.65 10.10 30.4 1.8 1.8 1.0 44.97 2.06 80.53 2.09 125.5 2.08 8.39 15.1 2.7 1.3
Note to Table: Figures in table may not add correctly due to rounding
in areas of broader spaced drilling.(1)(2)(3)
Proven Probable Mineral Reserve Tonnes (Mt) Au (g/t) Tonnes (Mt) Au (g/t) Tonnes (Mt) Au (g/t) Cont Au (Moz) New Reserve (1)(2)(3) 125.5 1.04 151.5 1.21 277 1.13 10.1 Previous Reserve(4) 102.4 1.09 142.9 1.19 245.4 1.15 9.1
Notes to Table: (1) Includes: Open Pit reserves totaling 266.6Mt @ 1.09g/t, Underground reserves totaling 1.1Mt @ 16.30g/t, Surface stockpiles totaling 9.4Mt @ 0.57g/t (2) Based on mined surfaced as at 31 December 2011 and a gold price of US$1,100/oz (3) Ultimate Open Pit design has a waste to ore ratio of 5.6:1 (4) Announced 15 September 2010 at US$900/oz Au