cave cave 3 1 NSF Center for Advanced Vehicle and Extreme - - PowerPoint PPT Presentation

cave
SMART_READER_LITE
LIVE PREVIEW

cave cave 3 1 NSF Center for Advanced Vehicle and Extreme - - PowerPoint PPT Presentation

Influence of Surface Composition and Substrate Roughness on Tin Whisker Growth Roughness on Tin Whisker Growth Sn Whisker Telecon Sn Whisker Telecon May 26, 2010 M J Bozack 1 E R Crandall 1 C E M. J. Bozack 1 , E. R. Crandall 1 , C. E. Rodekohr


slide-1
SLIDE 1

Influence of Surface Composition and Substrate Roughness on Tin Whisker Growth Sn Whisker Telecon Roughness on Tin Whisker Growth Sn Whisker Telecon

May 26, 2010 M J Bozack1 E R Crandall1 C E

  • M. J. Bozack1, E. R. Crandall1, C. E.

Rodekohr2, G. T. Flowers3, and P. Lall3

1Department of Physics 2P

b t i C ll Cli t SC

2Presbyterian College, Clinton SC 3Department of Mechanical Engineering

Auburn University, Auburn, AL 36849 Auburn University, Auburn, AL 36849 bozack@physics.auburn.edu www.physics.auburn.edu/aussl

cave cave3

NSF Center for Advanced Vehicle and Extreme Environment Electronics

1

slide-2
SLIDE 2

Chi L l I t t

Research Areas

Chip-Level Interconnects Flip-Chip and Underfills Component Reliability Component Reliability Prognostic Health Management Systems Connectors, and System- Level Interconnects Degradation and Wear Mechanisms

cave3

Mechanisms Harsh Electronics Systems and Manufacturing Lead-Free Solder Alloys Constitutive and Wetting Behavior

cave cave3

NSF Center for Advanced Vehicle and Extreme Environment Electronics

2

Behavior

slide-3
SLIDE 3

CAVE Resources

M d li S f M

CAPABILITIES

Accelerated Testing

Thermal Cycling Drop-Testing Vibration

Failure Analysis

SEM, AES, XPS, ISS EDX FTIR

Modeling and Simulation

ANSYS, ABAQUS, Hypermesh, LS-DYNA Solid Edge, Meshfree l b

Surface Mount Assembly

MPM Printer Agilent SP1 Inspection Asymtek Flux Jetting Si S AC

Vibration THB, SIR Temp-Vibration FTIR STEM RBS Nastran, Matlab Peridynamics Pro-Engineer

Siemens SIPLACE VISCOM VPS 6053 Heller 1800

Website: cave.auburn.edu

cave cave3

NSF Center for Advanced Vehicle and Extreme Environment Electronics

3

slide-4
SLIDE 4

Outline of Talk

Implementation of Pb-free electronics has resulted in the use of pure tin (Sn) surface finishes which are known to pose reliability issues due to the surface finishes which are known to pose reliability issues due to the spontaneous growth of Sn whiskers. In this talk, we focus on four aspects of whisker growth:

  • Whisker basics.
  • Surface composition of Sn whiskers.
  • Influence of substrate surface roughness on whisker growth
  • Influence of substrate surface roughness on whisker growth.
  • Growth of Sn whiskers on semiconductor and insulator

surfaces.

cave cave3

NSF Center for Advanced Vehicle and Extreme Environment Electronics

4

slide-5
SLIDE 5

What are Tin (Sn) Whiskers?

Sn whiskers are single crystal Sn eruptions that grow from deposited tin films.

Th l t i ll d ti ith l th i f i t

  • They are electrically conductive with lengths varying from microns to

millimeters and thicknesses from 0.5-10 microns.

  • Whisker densities (whiskers/cm2) can vary from a few to thousands.
  • Unpredictable incubation period (hours, days, years).

Unpredictable incubation period (hours, days, years).

Cause: No current consensus. Thin film stress (usually compressive) thought to

drive Sn atoms to the whisker base by long-range diffusion along surfaces, interfaces, and grain boundaries. interfaces, and grain boundaries.

cave cave3

NSF Center for Advanced Vehicle and Extreme Environment Electronics

5

slide-6
SLIDE 6

cave cave3

NSF Center for Advanced Vehicle and Extreme Environment Electronics

6

slide-7
SLIDE 7

Reliability Concerns

Tin whiskers have become an increasing reliability concern due to the d d f ll t l t i d ti d demand for smaller, more compact electronics and continued progress toward lead free electronics.

Failure Modes Caused by Tin Whiskers

  • Electrical Shorts
  • Permanent if current < melting current
  • Intermittent if current > melting current

Glass

Sn Sn

~ 20 ~ 20 m

  • Metal Vapor Arcing
  • High levels of current can cause whiskers

to vaporize into a conductive plasma.

Glass

  • Plasma subsequently forms an arc capable
  • f sustaining hundreds of amps of current.

Near bridging whisker

cave cave3

NSF Center for Advanced Vehicle and Extreme Environment Electronics

7

whisker

slide-8
SLIDE 8

cave cave3

NSF Center for Advanced Vehicle and Extreme Environment Electronics

8

slide-9
SLIDE 9

Distinctives of AU/CAVE Approach to Whiskers

  • Employ sputtered films exclusively not electrodeposited films
  • Employ sputtered films exclusively, not electrodeposited films.
  • Use very thin films (~ 0.2 microns).
  • “Dialed in” compressive film stress (we want to grow whiskers).

Dialed in compressive film stress (we want to grow whiskers).

  • Focused research objectives; attempt to answer a limited set of

questions.

  • “Laboratory” created whisker specimens, as opposed to studies of

archival, industrial, and/or sporadic whiskers.

cave cave3

NSF Center for Advanced Vehicle and Extreme Environment Electronics

slide-10
SLIDE 10

Part I Surface and Bulk Composition of Sn Whiskers Surface and Bulk Composition of Sn Whiskers

Background and Objectives: Materials Background and Objectives:

This work documents high-resolution measurements of several important materials and surface properties of Sn whiskers:

Materials Brass (Goodfellow) Sn (Lesker, sputter target) 00 Å /

  • surface composition
  • thickness of whisker oxide
  • variations in surface composition along the

whisker shaft

1600 Å Sn on Cu/Zn Techniques

  • composition at the blunt end of the whisker shaft
  • composition as a function of depth into the

whisker

  • whether the growth substrate (in this case, brass)

constituents are observed either on the growing

Auger electron spectroscopy (AES) SEM

g g whisker surface or in the whisker bulk.

Sn whiskers have long been presumed to be pure Sn, largely as a result of comparative X-ray diffraction studies on substrates both with and without whiskers. The limitation of conventional diffraction approaches, however is that it averages data from many individual grains rather than from a single grain

cave cave3

NSF Center for Advanced Vehicle and Extreme Environment Electronics

10

however, is that it averages data from many individual grains rather than from a single grain.

slide-11
SLIDE 11

Basics of Auger Electron Spectroscopy

Signal Volume

The Auger Process

Signal Volume

AES: Electrons IN, Electrons OUT Pierre Auger, The Man Analysis Volume Comparison AES and EDX

cave cave3

NSF Center for Advanced Vehicle and Extreme Environment Electronics

11

slide-12
SLIDE 12

Auger Electron Spectroscopy of a Sn Whisker

Whisker and Analysis Orientation Whisker and Analysis Orientation

Overall View Start of Whisker Middle of Whisker End of Whisker

cave cave3

NSF Center for Advanced Vehicle and Extreme Environment Electronics

12

slide-13
SLIDE 13

Auger Electron Spectroscopy of a Sn Whisker

As Received Whisker, Representative Result As Received Whisker, Representative Result

Conclusion: “As received” surface composition at three locations along whisker shaft shows only Sn (no brass) to the limit of detection (~ 100 ppm; ~ 0 1 at % of analyzed volume) of AES ~ 0.1 at % of analyzed volume) of AES.

Zn (LMM) = 994 eV

End of Whisker

Cu (LMM) = 920 eV Related Works: 1) T. Woodrow, Proc. SMTA Int’l Conf., Sept, 2006 (“Bible” of whisker diffusion studies); 2) K. F ji d R K k J A l Ph 51 (1980) 6231 (40 kV i id t b !?)

cave cave3

NSF Center for Advanced Vehicle and Extreme Environment Electronics

13

Fujiwara and R. Kawanaka, J. Appl. Phys. 51 (1980) 6231 (40 kV incident beam energy !?)

slide-14
SLIDE 14

Whisker Surface Composition

Compared to Surrounding Sn Surface Compared to Surrounding Sn Surface

cave cave3

NSF Center for Advanced Vehicle and Extreme Environment Electronics

14

slide-15
SLIDE 15

Auger Depth Profile into a Sn Whisker

Composition vs Depth

At Surface

Composition vs. Depth

Surface oxide sputtered away Ǻ after ~ 250 Ǻ No evidence of brass in the whisker bulk

cave cave3

NSF Center for Advanced Vehicle and Extreme Environment Electronics

15

slide-16
SLIDE 16

Why So Few Direct Analyses of Whiskers?

The Analytical Challenge

  • The unfavorable aspect ratio of the cylindrical type of Sn whiskers requires submicron

imaging and analysis techniques.

  • High performance AES, SIMS, FIB instruments are pricey, on the order of ~ $1M.

The Analytical Challenge

High performance AES, SIMS, FIB instruments are pricey, on the order of $1M.

  • Whiskers can be delicate. In the course of this work, we encountered several cases of

whiskers that either disappeared during analysis or during overnight parking in our vacuum

  • system. It requires a high degree of experience, luck, and careful handling to achieve

successful analysis.

  • There is an inverse correlation between lateral resolution vs beam current (S/N) in high-

resolution surface spectroscopy.

  • As the incident beam current is increased, there is likelihood of discernible electron-beam

damage to the analyzed structure due to joule heating during the long analysis times required to acquire sufficient S/N in the Auger spectrum It is easy to dump enough beam required to acquire sufficient S/N in the Auger spectrum. It is easy to dump enough beam current in a Sn whisker to volatilize it completely.

  • The long analysis times required to achieve adequate S/N demands an Auger system that

is electrically and mechanically drift-free over a time of ~ 30 minutes. This can be especially difficult for oxide-covered surfaces which can electrically charge during the l d d f analysis and cause image-drifting.

  • Sixth, sputter profiling for such small and delicate structures is problematic. Automated

sputter profiling routines are risky and we instead relied on a series of manual sputtering/spectrum cycles.

cave cave3

NSF Center for Advanced Vehicle and Extreme Environment Electronics

slide-17
SLIDE 17

Auger Electron Spectroscopy of a Sn Whisker

Diffi lti f A l i El t d I B D Difficulties of Analysis: Electron and Ion Beam Damage

AES Instrument Conditions Instrument: PHI 680 Field Emission AES Nanoprobe Electron Beam Conditions: 10kV 10nA; 30º sample tilt and 5kV 8nA; 30º sample tilt Electron Beam Conditions: 10kV, 10nA; 30 sample tilt and 5kV, 8nA; 30 sample tilt Ion Beam Conditions: Ar+, 2kV, 1µA, 2x2 mm2 raster; Rate=~ 50 Å/min relative to SiO2

E-beam damage damage Before E-beam exposure After E-beam exposure

cave cave3

NSF Center for Advanced Vehicle and Extreme Environment Electronics

17

p p

slide-18
SLIDE 18

Auger Electron Spectroscopy of a Sn Whisker

Sn Whisker Damage During (2 kV) Ar+ Sputtering g g ( ) p g

Whisker Whisker after 250 Å Sputtering Whisker after 500 Å Sputtering Whisker after 1000 Å Sputtering Whisker after 1000 Å sputtering and AES p g and AES analysis

cave cave3

NSF Center for Advanced Vehicle and Extreme Environment Electronics

18

slide-19
SLIDE 19

The Feedstock Issue in Whiskering

From Whence the Sn Cometh? From Whence the Sn Cometh?

Question: It is amazing that  100 m long whiskers can be generated from such a thin layer of Sn on the

No Brass !!

Zn Position

can be generated from such a thin layer of Sn on the brass surface. We Ask: If the entire thin film thickness (1600 Å of Sn) is used to make a Sn whisker, what (feedstock) area possibilities exist around the whisker root?

Cu Position

Whi k

Whisker Length (µm) Whisker Volume (

3)

Area of 0.6 µm Sn Thin Film Needed to S th i Radius of Circular Area Around Whisker Base N d d f Whi k

Whisker Sn

(µ ) (µm3) Synthesize Whisker (µm2) Needed for Whisker Synthesis (µm) 1 0.20 0.33 0.32 10 2.0 3.3 1.0 100 20 33 3.2

Feedstock

1000 200 330 10 Whisker radius 0.25 µm Film Thickness 0.6 µm Assumption: Density of Sn whisker and surrounding Sn film are identical.

cave cave3

NSF Center for Advanced Vehicle and Extreme Environment Electronics

19 p y g

slide-20
SLIDE 20

Evidence for Localized Sn Film Depletion

Ag Whiskers on Brass Ag Whiskers on Brass

Our early work in this area attempted to locate “depletion” areas around fast growing whiskers, indicating a localized Sn feedstock origin. While we see, in isolated cases, small “depletion” depressions around whiskers, they are rare. More likely is a uniform “draining of the swamp” indicating long-range Sn diffusion, discussed further below.

Several nub-like Ag whiskers on brass. Areas of potential localized grain subsistence are highlighted with arrows.

cave cave3

NSF Center for Advanced Vehicle and Extreme Environment Electronics

20

subsistence are highlighted with arrows.

slide-21
SLIDE 21

Conclusions

  • High-aspect ratio Sn whiskers on brass grown from sputtered Sn under

intrinsic compressive stress consist of ~ 100% Sn covered with a ~ 200 Å p layer of native oxide, at least to the limit of detection of Auger spectroscopy (~ 100 ppm or ~ 0.1 at % in the analyzed volume).

  • There are no variations in the whisker surface composition along the

whisker shaft whisker shaft.

  • The bulk composition of whiskers is pure Sn with no evidence of

elemental pull-up from the brass substrate.

  • The Sn oxide is a garden-variety oxide similar to that found on typical Sn

f

  • surfaces. More detailed studies using X-ray photoelectron spectroscopy

(not reported here) show that the oxide on Sn consists of Sn, SnO, SnO2, and O-Hx groups.

  • That ~ 500 m pure Sn whiskers are observed to grow from submicron

 p g layers of Sn supports the presumption that surface, grain boundary, and interfacial Sn migration supplies the feedstock for whisker growth in Sn.

cave cave3

NSF Center for Advanced Vehicle and Extreme Environment Electronics

21

slide-22
SLIDE 22

Movie Whisker Exoskeletons as Viewed by Real-Time Scanning Electron Microscopy

(obtain at ftp://131.204.44.20 under title “Death of a Sn Whisker”)

cave cave3

NSF Center for Advanced Vehicle and Extreme Environment Electronics

22

slide-23
SLIDE 23

Part II Influence of Surface Roughness g

  • n Sn Whisker Growth

Background and Objectives

  • Determine impact of surface

smoothness on Sn whisker growth. Materials Brass (Goodfellow) Sn (Lesker, sputter target) g

  • Specify and characterize method that

produces the smoothest brass substrate and deposited Sn surface. 1500 Å Sn on Cu/Zn Motivation Can surface roughness alter Sn whisker growth? Techniques Atomic Force Microscopy (AFM) SEM growth? SEM

cave cave3

NSF Center for Advanced Vehicle and Extreme Environment Electronics

23

slide-24
SLIDE 24

Brass Substrate Preparation Options Options

1) Unpolished Surface 2) Mechanically Polished Surface ) y

  • Grind in successively smaller

increments to 1200 grit

  • Polish with a 3 mm diamond

Polish with a 3 mm diamond suspension

  • Polish with a polishing agent on

a polishing cloth

Sn deposited under Ar gas background

3) Electrochemically Polished Surface

p g g conditions selected to develop compressive stress in the Sn film.

cave cave3

NSF Center for Advanced Vehicle and Extreme Environment Electronics

24

slide-25
SLIDE 25

AFM Characterization of Brass Surface Roughness

RMS roughness values in units of nm/100 µm2

Brass Surface Roughness

Unpolished Roughness: 33.9 Mechanically Polished Roughness: 6.4 Electrochemically Polished Roughness: 2.6 AFM Images Surface Asperity Distribution Distribution

cave cave3

NSF Center for Advanced Vehicle and Extreme Environment Electronics

25

Wider distribution  More roughness

slide-26
SLIDE 26

AFM Characterization of Deposited Sn Roughness

RMS roughness values in units of nm/100 µm2 Unpolished Roughness: 101.7 Mechanically Polished Roughness: 85.5 Electrochemically Polished Roughness: 76.7

Deposited Sn Roughness

AFM Images Surface Asperity Distribution Distribution

cave cave3

NSF Center for Advanced Vehicle and Extreme Environment Electronics

26

slide-27
SLIDE 27

Observed Whisker Growth

Four Months at Room Temperature Four Months at Room Temperature

Electrochemically Polished Mechanically Polished Unpolished

Hundreds of long whiskers found on a 2 x 2 cm specimen. Intermediate number of whiskers that are well- d l d d l Fewest number of whiskers. Most are small and nub-like i

cave cave3

NSF Center for Advanced Vehicle and Extreme Environment Electronics

27

developed and long. in appearance.

slide-28
SLIDE 28

Whisker Statistics

120 Days Incubation RT/RH 120 Days Incubation, RT/RH

Initial Whisker Average Surface Condition Substrate Roughness (nm/100 µm2) Whisker Population Density (cm-2) Average Length (µm) Longest Whisker Lengths (µm) Electrochemically

2 62 2265 15 20 80

y Polished

2.62 2265 15-20 80

Mechanically Polished

6.42 598 8 100, 60, 60

As Received

33.87 55 5 14

As Received

33.87 55 5 14

cave cave3

NSF Center for Advanced Vehicle and Extreme Environment Electronics

28

slide-29
SLIDE 29

Conclusions

Number of Whiskers

Results are contrary to conventional wisdom which presumes that rougher surfaces offer more film stress and enhanced whisker growth. more film stress and enhanced whisker growth.

Electropolished Mechanically Unpolished Electropolished

RMS roughness

Mechanically Polished

RMS roughness

Unpolished

RMS roughness

«

Brass: 2.6 nm/100m2 Sn: 77 nm/100m2 Brass: 6.4 nm/100m2 Sn: 86 nm/100m2 Brass: 33.9 nm/100m2 Sn: 102 nm/100m2

Higher whisker densities on smoother surfaces

cave cave3

NSF Center for Advanced Vehicle and Extreme Environment Electronics

29

slide-30
SLIDE 30

Part III Growth of Sn Whiskers on Semiconductors and Insulators

B k d d Obj ti Background and Objectives:

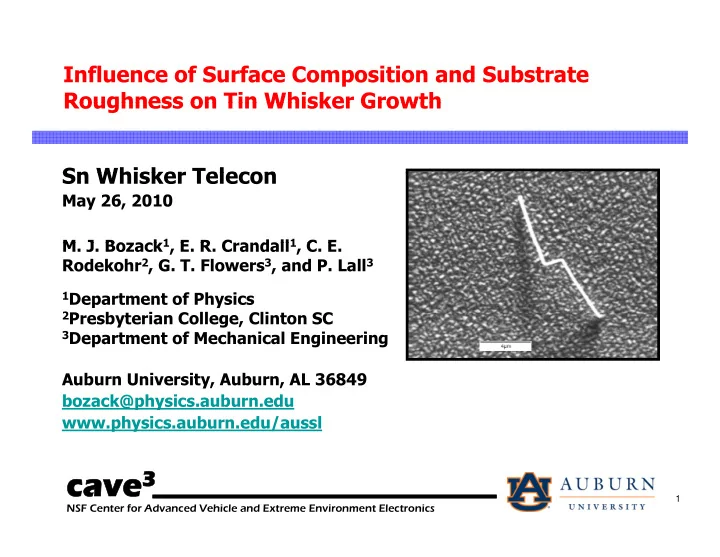
Previous work has shown growth of Sn whiskers

  • n film systems that form no IMC (e.g., Al, Si, Zn)

and therefore offer no contribution to internal

Experimental:

  • Deposit thin films of Sn on Si, GaAs,

InAs, InP, Ge, and glass under high compressive stress conditions

film stress. Can this result be generalized to

  • ther classes of materials that are not expected

to form IMC? Growing whiskers on semiconductors/insulators

  • SEM characterization of whisker

growth and number density

  • RBS and profilometry as a function of

incubation time, to determine film

will also help us in other ways:  Most semiconductor surfaces are atomically smooth and

allows study of whether whisker growth is even higher than on electro-polished surfaces.  Atomically smooth surfaces allows us to measure feedstock

incubation time, to determine film thickness depletion as whiskers grow.

 Atomically smooth surfaces allows us to measure feedstock depletion in a non-destructive, more accurate way by using RBS and stylus profilometry rather than by AES depth profiling.  Corollary is to compare whisker growth for cases where CTE mismatches between substrates and Sn are similar.

cave cave3

NSF Center for Advanced Vehicle and Extreme Environment Electronics

30

slide-31
SLIDE 31

Experimental Details

Sputter Deposition Conditions

Pure Sn target, Kurt Lesker Employed background Ar pressure (2 mT) during deposition to produce intrinsic during deposition to produce intrinsic compressive film stress

Substrates Deposited Film Thicknesses Sputtering System

  • Si
  • GaAs
  • InP
  • InAs

p

(measured by profilometry) 1600 Ǻ

Experimental Methodology

  • InAs
  • Ge
  • Glass

Experimental Methodology

  • Incubate ~ 200 days at RT
  • SEM/image analysis
  • Count and measure the whiskers
  • AES/RBS thickness measurements

Generated Specimens

cave cave3

NSF Center for Advanced Vehicle and Extreme Environment Electronics

31

slide-32
SLIDE 32

Whisker Growth Statistics

Incubation Period: 54 days Incubation Period: 54 days

Substrates (1600 Å S fil ) Whisker D it Average Whi k Standard D i ti Mode* ( ) (1600 Å Sn film) Density (cm-2) Whisker Length (µm) Deviation (µm) (m) Si 15195 6.6 9.1 2

Sn on GaAs @ 3760X

Glass 262 2.5 0.7 N/A InAs 655 6.0 3.5 N/A GaAs 7074 4.2 3.8 2 GaAs 7074 4.2 3.8 2 InP 3668 3.3 1.6 2 Ge 19911 7.5 7.6 2 *Mode is defined as the most frequently observed whisker length

Sn on InAs @ 5720X

cave cave3

NSF Center for Advanced Vehicle and Extreme Environment Electronics

32

slide-33
SLIDE 33

Whisker Growth Statistics

Incubation Period: 116 days

High whisker densities but with relatively shorter whisker lengths

Incubation Period: 116 days

Substrates (1600 Å S Whisker D it Average Whi k Standard D i ti Mode* ( )

g compared to other studied materials.

Sn on Ge @ 2820X

(1600 Å Sn film) Density (cm-2) Whisker Length (µm) Deviation (µm) (m) Si 38512 6.5 7.9 2

@

Glass 1703 2.5 0.7 2 InAs 23710 8.3 5.8 6 GaAs 27378 6 9 6 5 2 GaAs 27378 6.9 6.5 2 InP 21221 6.9 6.2 2 Ge 39167 6.6 6.8 2 *Mode is defined as the most frequently observed whisker length

cave cave3

NSF Center for Advanced Vehicle and Extreme Environment Electronics

33

slide-34
SLIDE 34

Sn Whiskers on Semiconductor/Insulator Substrates

Sn on Si @ 6350X Sn on Glass @ 9050X Sn on InAs @ 4020X Sn on GaAs @ 4270X Sn on InP @ 3760X Sn on Ge @ 7100X

cave cave3

NSF Center for Advanced Vehicle and Extreme Environment Electronics

34

slide-35
SLIDE 35

Coefficient of Thermal Expansion (CTE) Mismatches

CTE mismatches similar between Sn and the various

Substrate CTE (10-6/K) ΔCTE* %ΔCTE*

and the various substrates but widely varying whisker densities observed. Little correlation.

( / )

Sn 23.4 Si 5 1 18 3 78 2 Si 5.1 18.3 78.2 Glass (pyrex) 4.0 19.4 82.9 InP 4.6 18.8 80.3 GaAs 5.7 17.7 75.6 InAs 4.5 18.9 80.8 Ge 6.1 17.3 73.9

*Compared to Sn

cave cave3

NSF Center for Advanced Vehicle and Extreme Environment Electronics

35

slide-36
SLIDE 36

Attempt to Measure Sn Film Thickness after Whisker Growth

Rutherford Backscattering Spectroscopy (RBS)

Incident 2 MeV α particle

Sn

b

counts d( h l #) t t l # f ' tt d i t d t t     

Incident 2 MeV α particle beam with current I, ∆t Detector r

Sn

θ

GaAs

a

= d(channel #) = total # of 's scattered into detector channel        

x = ~ film thickness dσ N n dΩ dω 

300 350 0.5 1.0 1.5 2.0

Energy (MeV)

Sn on GaAs

N = nuclei density of the sample

RBS works best when the film stack is laminar and the film thickness.

150 200 250

malized Yield

Sn Sn on GaAs

50 100

Norm

Sn GaAs

Energy loss by -particles as they are scattered from the front and back surface of the Sn film (the a – b distance in the RBS spectra) yields the Sn film thickness.

cave cave3

NSF Center for Advanced Vehicle and Extreme Environment Electronics

36

100 200 300 400 500

Channel

a b

slide-37
SLIDE 37

Sn Film Thickness vs Incubation Time

Rutherford Backscattering Spectroscopy

Are we “draining the Sn swamp” during whisker growth ?? YES . . . InP GaAs

100 Ǻ

Up tick is due to growth of whiskers

  • n the surface,

which “looks” to the RBS beam as the RBS beam as an “increase” in film thickness.

RBS data was taken at two widely spaced positions on each sample, each position producing similar results.

cave cave3

NSF Center for Advanced Vehicle and Extreme Environment Electronics

37

sample, each position producing similar results.

slide-38
SLIDE 38

Sn Film Thickness vs Incubation Time

Sanity Check

Question: Believing the RBS data showing that ~ 100 Ǻ of the Sn film on GaAs has been depleted during whisker growth over ~ 120 days what

100Å of Sn depletion on

Whisker Density (cm-2) Average Length (μm)

Sanity Check

growth over ~ 120 days, what possibilities exist for the resulting whisker density and length?

p GaAs corresponds to . . .

5000 28.29 10000 14.15 15000 9.43 20000

7.07 Measured Sn whisker length

  • n Sn/GaAs

27378

5.17 30000 4.72

Measured Sn whisker density on

40000 3.54

Sn/GaAs

cave cave3

NSF Center for Advanced Vehicle and Extreme Environment Electronics

38

slide-39
SLIDE 39

Conclusions

  • It is clear that Sn whiskers grow readily on thin, sputter-deposited Sn films on

semiconductor and insulator substrates under internal compressive film stress conditions semiconductor and insulator substrates under internal compressive film stress conditions where intermetallic layers are absent.

  • The fact that Sn on semiconductor surfaces grows copious amounts of whiskers is

consistent with our earlier work on surface roughness, which showed that smoother surfaces grow more whiskers. Semiconductor surfaces are the smoothest surfaces that can be technologically manufactured.

  • RBS studies show evidence of the slight Sn film depletion expected during whisker growth,
  • wing to the mass balance that must occur when forming Sn whiskers. We observe a
  • wing to the mass balance that must occur when forming Sn whiskers. We observe a

decrease of ~ 100 Å in the thickness of the deposited Sn film during the incubation period (130 days). The fact that identical RBS results were obtained over two widely separated analysis positions on the film surface support the notion of long-range lateral movement of Sn to the whisker shaft during whisker growth.

  • No simple correlation due to CTE mismatches was found between the various

semiconductor substrates (having similar CTEs) and Sn whisker growth.

cave cave3

NSF Center for Advanced Vehicle and Extreme Environment Electronics

39

slide-40
SLIDE 40

Acknowledgements

We gratefully acknowledge the industrial members of the NSF Center for Advanced Vehicle and Extreme Environment Electronics (CAVE3) for Advanced Vehicle and Extreme Environment Electronics (CAVE ) for continued support of this work.

cave cave3

NSF Center for Advanced Vehicle and Extreme Environment Electronics

40