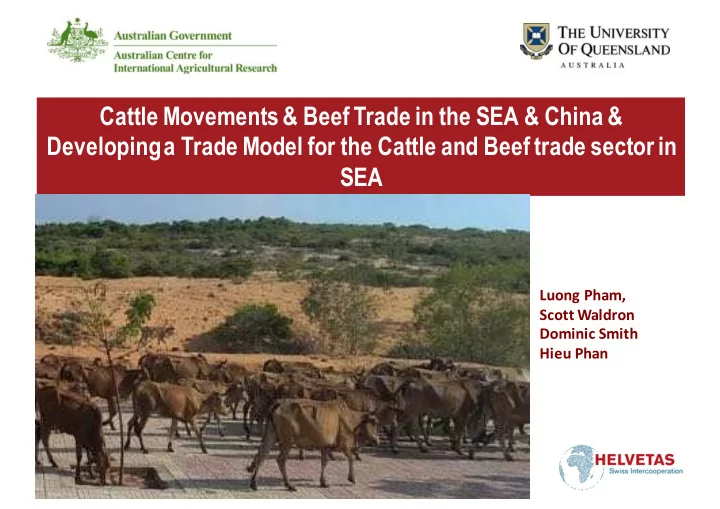

Cattle Movements & Beef Trade in the SEA & China & Developing a Trade Model for the Cattle and Beef trade sector in SEA Luong Pham, Scott Waldron Dominic Smith Hieu Phan
Outline of the presentation • Background-production, consumption, trade & prices • Trends of cattle movement and beef trade • Development of a trade model for the cattle and beef trade sector • Development of information dissemination mechanisms
Introduction to cattle trade/movement in SEA & China Consumption up Cattle production VS (income + Prices up steady urbanisation) Plus Increased Trade/ Integration Movement of cattle in the region
Background – production indicators Ann av growth average Ann av Beef Average Stock Turnoff carcass growth (thousand carcass (million (million Turnoff rate turnoff rate tonnes, weight (kg, weight head, 2014) head, 2014) (2000-14) 2014 (2000-14) 2014) 2014) Australia cattle 29.1 9.9 34% 0.5% 2,595 183 -2.7% Myanmar bovines 15.5 0.7 6% 8.1% 111 161 0.2% Cambodia bovines 3.1 0.2 6% 4.1% 18 120 0.0% Laos bovines 1.7 0.3 18% 2.5% 25 85 0.9% Thailand cattle 4.9 0.7 14% 3.2% 119 182 0.3% Timor Leste cattle 0.2 0.0 10% -1.0% 2 98 0.0% Vietnam bovines 5.2 1.8 35% 7.2% 345 172 2.0% Malaysia cattle 0.8 0.1 18% 0.3% 53 189 1.9% Indonesia cattle 13.7 2.7 19% 0.1% 498 147 0.4% China bovines 92.7 34.1 37% 2.0% 6,107 177 1.0% China-Southeast Asia 137.8 40.5 29% 1.6% 7,276 175 0.9%
Annual growth in production Growth in stock number, turnoff and beef production (%) 14% 12% 10% 8% 6% 4% 2% 0% -2% -4% Stock numbers Turnoff Meat production Growth in stock numbers, turnoff and beef production in the China-Southeast Asia region
Per capita supply & drivers Myanma Vietnam China Australia Thailand Timor Malaysia Indonesia China- r bovine Cambodia Laos bovine bovine beef Leste beef beef SEA meat meat meat Beef supply Beef supply (kg/person 2014) 62.7 2.1 1.2 3.7 1.8 1.5 4.3 7.2 2.7 5.4 4.7 Annual growth 2000- 2014 (%) -0.3% 7.7% 2.6% 5.6% -0.5% 0.9% 12.0% 1.9% 2.3% 1.8% 1.9% Demographics (annual growth 2000-2104) Population growth 1.5% 0.8% 1.6% 1.6% 0.6% 2.3% 1.0% 1.8% 1.3% 0.5% 0.7% Urbanisation rate 0.2% 1.5% 0.7% 4.1% 3.2% 1.9% 2.1% 1.3% 1.7% 3.1% 2.8% GDP per capita 1.5% 6.0% 5.7% 3.5% 2.9% 5.2% 3.0% 4.0% 9.2% 5.3% Factors in beef consumption Population 123% 10% 38% 22% 71% 8% 47.7% 36% 23% 25% Other (urbanisation, incomes) -23% 90% 62% 78% 29% 92% 52.3% 64% 77% 75%
Consumption 5 4.5 4 3.5 kg / capita / year 3 2.5 2 1.5 1 0.5 0 2000 2001 2002 2003 2004 2005 2006 2007 2008 2009 2010 2011 2012 2013 2014 Indonesia beef Vietnam bovine meat China urban bovine meat China rural bovine meat China weighted average bovine meat
Prices Real beef prices USD 2010=100 12 10 8 6 4 2 0 2000 2001 2002 2003 2004 2005 2006 2007 2008 2009 2010 2011 2012 2013 2014 2015 Hanoi fillet Jakarta generic Beijing generic Thailand generic Cambodia generic Myanmar generic
Growth in per capita beef production and consumption, trade and prices 60% Growth in per capita beef production and consumption, trade and prices (%) 50% 60% 40% 50% 30% 40% 20% 30% 10% 20% 0% 10% -10% 0% -10% Per capita domestic beef/bovine meat production Per capita beef / bovine meat consumption Beef / bovine meat and cattle trade Beef / bovine meat prices Per capita domestic beef/bovine meat production Per capita beef / bovine meat consumption Beef / bovine meat and cattle trade Beef / bovine meat prices
Cattle movement & trade Feb 2017
Cattle movement & trade
Cattle movement & trade TRENDS • – Fewer cattle moved from Laos to Vietnam in 2016 è Indication of rebuilding herd, which is a priority by the Laos government – China is likely to demand less cattle from SEA, as it has removed restrictions on beef exports from India; live cattle imports from Australia – VN imported live cattle from Australia in 2016 reduced 46% (compared to 2015) – If Myanmar changes its slaughter and live export policy, then what would be the trend of live cattle and beef trade in the region? è In order to assess trends, and to forecast into the future, there is a need for a systematic tool that can simulate scenarios
Developing a trade model for the cattle and beef trade sector in SEA & China WHAT HAVE BEEN DONE? • Simplified model of the cattle/beef sector in South East Asia/China
Developing a trade model for the cattle and beef trade sector in SEA & China WHAT CAN THE MODEL BE USED FOR? • Model the impact of an increase in slaughtering costs to meet with escape standards • Model the impact of improved supply cold chain • Model impact of increased beef consumption in main cities • Model the impact on price and sources of supply if Myanmar cattle supply was cut off • Analysis of policy options for liberalization of Myanmar livestock regulatory frameworks, including changes to the regulations on cattle slaughtering and on live cattle exports.
Information dissemination mechanisms http://www.asiabeefnetwork.com Asia Beef Network Facebook group
Thank you
Recommend
More recommend