beef cattle in the world
play

Beef cattle in the world S1064 BIF, June 2019 > 50% cattle in - PDF document

6/20/2019 Beef cattle in the world S1064 BIF, June 2019 > 50% cattle in the world maintained in hot and humid Improving thermotolerance environments including ~ 40% of beef cows in US in beef cattle a genomic approach


  1. 6/20/2019 Beef cattle in the world S‐1064 BIF, June 2019 • > 50% cattle in the world – maintained in hot and humid Improving thermotolerance environments • including ~ 40% of beef cows in US in beef cattle – a genomic approach Raluca Mateescu | Associate Professor Animal Genomics Global distribution of cattle 1 2 Bos Indicus cattle Thermotolerance • Approximately 80% of global beef production is Bos Indicus based. • Climatic stress ‐ major limiting factor of Bos indicus germplasm: production efficiency • Critical role in US and • Adapted to heat and humidity worldwide beef production • Genomic tools can help select • Particularly when used as part • Resistant (or at least tolerant) to of a well‐structured internal and external parasites  Animals with superior ability for both thermal crossbreeding program • In crossbreeding systems adaptation and food production produce improved cattle:  Energy‐efficient, sustainable approach to meet • Fertile • Gain well the challenge of global climate change. • Long lived 3 4 In response to heat stress, 
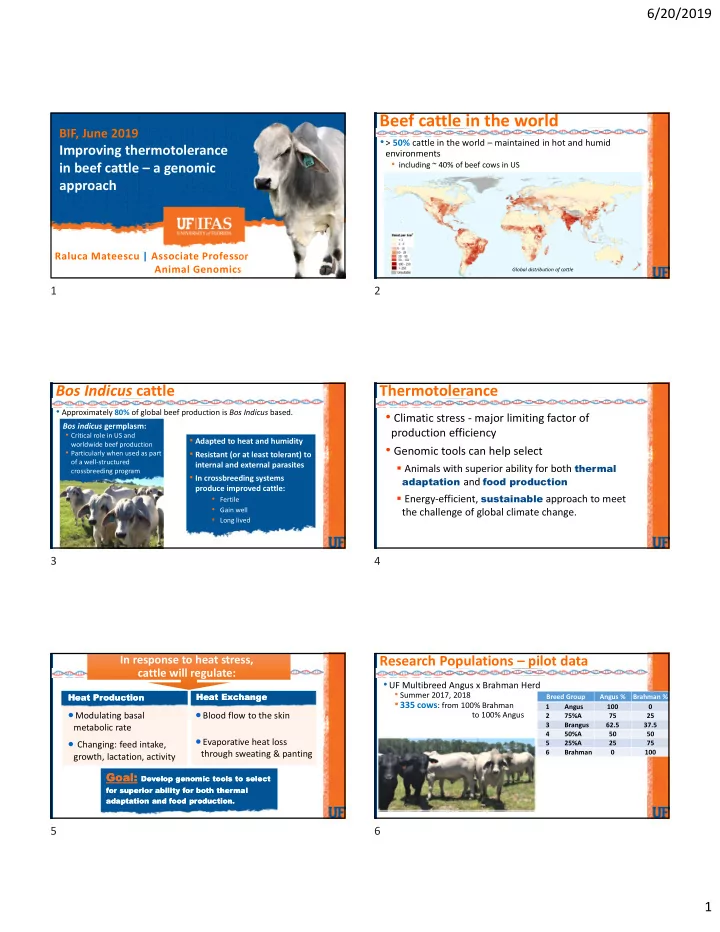
Research Populations – pilot data cattle will regulate: • UF Multibreed Angus x Brahman Herd • Summer 2017, 2018 Heat Exchange Heat Exchange Heat Production Heat Production Breed Group Angus % Brahman % • 335 cows : from 100% Brahman 1 Angus 100 0  Modulating basal  Blood flow to the skin to 100% Angus 2 75%A 75 25 3 Brangus 62.5 37.5 metabolic rate 4 50%A 50 50  Evaporative heat loss  Changing: feed intake, 5 25%A 25 75 6 Brahman 0 100 through sweating & panting growth, lactation, activity Goal: Develop genomic tools to select Goal: Develop genomic tools to select for superior ability for both thermal for superior ability for both thermal adaptation and food production. adaptation and food production. 5 6 1

  2. 6/20/2019 Breed effect on body temperature Internal Body Temperature • Vaginal temperature at 15‐min intervals for 5 days 39.8 85 • Air temperature and relative humidity ‐ recorded continuously in the 83 39.6 pastures 81 39.4 79 39.2 THI = (1.8 * dbt + 32)‐[(0.55‐0.0055*rh)*(1.8*dbt‐26.8)] THI = (1.8 * dbt + 32)‐[(0.55‐0.0055*rh)*(1.8*dbt‐26.8)] Body Temp (°C) 77 39 DS1922L iButton Temperature Logger ‐ 75 THI Maxim Integrated Products, 120 San 38.8 Gabriel Drive, Sunnyvale, CA 73 Range: ‐40°C to +85°C 1 inch Resolution: 0.0625°C (11 bit) or 0.5°C (8 bit) 38.6 71 38.4 iButton 69 38.2 67 38 65 CIDR 0 2 4 6 8 10 12 14 16 18 20 22 Hour ≥ 84 Critical heat stress vagtmp every 15 min by day ‐ REPEATED with 79 ‐ 83 Major heat stress cov structure type = ARH(1) 75 ‐ 78 Moderate heat stress ≤ 75 Minimal heat stress 7 8 Phenotypic Plasticicty Representing reaction norms in models • Ability of an individual to alter its phenotype in response to changes in environmental 86 conditions High THI (84‐86) 84 Phenotype 82 G i The ability of one genotype to produce more than one Mean THI (79‐81) P i ( E ) 80 phenotype when exposed to different environments. 78 Slope 76 P i 0 High Plasticity, Low THI (74‐76) Plasticity No Plasticity Intercept 74 strong GxE Environment Genotype A E 0 72 Phenotype Phenotype Phenotype 1 2 3 4 5 6 7 8 9 10 11 12 13 14 15 16 17 18 19 20 21 22 23 24 Genotype B THI over 24 hours Linear reaction norm Genotype C { P i 0 , s }: intercept and slope are considered as the evolving traits. P i ( E ): reaction norm is represented by a flexible function which Environment Environment Environment can evolve like a trait Each of the colored lines is a "Reaction Norm" Each of the colored lines is a "Reaction Norm" 9 10 Breed effect on phenotypic plasticity Breed effect on phenotypic plasticity 39.5 39.5 • Estimate the effect of various % of Angus Angus Brahman genes on phenotypic 39.4 39.4 75%A Brahman plasticity Brangus • Use a reaction norm approach via 39.3 39.3 Body Temperature (C) random regression mixed models . Body Temperature (C) 50%A 39.2 39.2 25%A 39.1 39.1 Brahman Breed Intercept Slope Angus 38.66 0.42 39.0 39.0 75%A 38.56 0.33 38.9 38.9 Brangus 38.58 0.30 38.8 Intercept 38.8 50%A 38.60 0.28 38.7 38.66 25%A 38.57 0.23 38.7 38.63 38.6 Brahman 38.63 0.20 38.6 74‐76 79‐81 84‐86 38.5 Estimate the effect of various % of Brahman genes on phenotypic plasticity 74‐76 79‐81 84‐86 Use a reaction norm approach via random regression mixed models . THI THI THI 11 12 2

  3. 6/20/2019 Response to different heat loads Factors important in thermotolerance Heat load = ∑ ∑ �𝑗𝑜𝑢𝑓𝑜𝑡𝑗𝑢𝑧 𝑦 𝑒𝑣𝑠𝑏𝑢𝑗𝑝𝑜� �𝑗𝑜𝑢𝑓𝑜𝑡𝑗𝑢𝑧 𝑦 𝑒𝑣𝑠𝑏𝑢𝑗𝑝𝑜� ��� ����� ��� ����� Coat 39.8 85 83 39.6 Hair 81 39.4 79 Body Temp (C) 39.2 77 Sweat THI 39 75 Glands 73 38.8 71 38.6 69 38.4 67 Other 38.2 65 Long Hair Length 0 2 4 6 8 10 12 14 16 18 20 22 24 2 4 6 8 10 12 14 16 18 20 22 24 Skin Prop. 0 2 4 6 8 10 12 14 16 18 20 22 24 26 28 30 32 34 36 38 40 42 44 46 48 Long Hair Diameter Low THI‐load day Short Hair Length High THI‐load day Short Hair Diameter 13 14 Factors important in thermotolerance Factors important in thermotolerance Coat Coat Hair Score Sweat Glands Sweat Sweat Angus Glands Glands Long Hair Length Short Hair Length Other Other Skin Prop. Skin Prop. Brahman 15 16 Factors important in thermotolerance Factors important in thermotolerance Coat Coat Score Score Sweat Sweat Glands Glands 100%A 75%A Brangus 50%A 25%A 0%A Other Other Significant linear effect of percentage Brahman composition Skin Prop. Skin Prop. Skin Histology Fraction of Brahman genes 0 0.25 0.5 0.75 1 17 18 3

  4. 6/20/2019 Research (Training) Population Thermotolerance measurements • Brangus heifers, Seminole Tribe of Florida • Vaginal temperature 15 min over 5 days • Environmental data: temperature, humidity, THI • Summer 2016, 2017, 2018 • Sweating rate • 2,300 two‐year old heifers • Coat : color, coat score, hair length & diameter • Temperament : chute and exit score • Body condition score • Skin biopsies: for histology & gene expression • Weight gain over the summer/fall • Rump fat and rib fat ultrasound • Subsequent pregnancy status • 250K genotypes 19 20 Future work GWAS – genomic regions individual traits Short Hair Length 0 1 2 3 4 5 6 7 8 ‐log10 P‐value • Gene networks for individual thermoregulation and production • SVS (SNP & Variation Suite) v8.8.1 traits (Golden Helix) • Transcriptomics analysis of skin tissues • Mixed Model GWAS using a single Long Hair Length 0 1 2 3 4 5 6 7 ‐log10 P‐value locus (EMMAX) • eQTL analysis to reveal genetic pathways for thermotolerance • Genomic relationship matrix • Temperature under High and Low THI, which are independent or positively associated with production Sweat gland area, Hair length performance  140,467 SNPs 0 2 4 6 8 10 Sweat Gland Area ‐log10 P‐value • Heritability estimates: • Temp Low THI = 0.24 • Temp High THI = 0.36 Skin Thickness • Hair length = 0.21 0 1 2 3 4 5 ‐log10 P‐value • Sweat gland area = 0.23 21 22 Conclusions Acknowledgments • Cattle with different Brahman percentage vary in their Seminole Tribe of Seminole Tribe of University of Florida University of Florida Financial Support Financial Support Florida Florida • Dr. Pete Hansen • Alex Johns phenotypic plasticity of core body temperature in response to •USDA‐NIFA Grant 2017‐67007‐26143 • Dr. Mauricio Elzo • Phillip Clark •UF Agricultural Experim. Station • Dr. Dwain Johnson environmental heat stress. • Sheri Holmes •UF ANS Hatch Project • Dr. Tracy Scheffler •Seminole Tribe of Florida • Bobby Yates • Dr. Jason Schaffler •Brangus Breeders Association • Mike Ciorocco • Dr. Serdal Dikmen • The thermoregulation associated traits have a genetic •Florida Beef Council • Dayne Johns, etc. • Danny Driver •Florida Cattlemen’s Association • Michelle Driver component (h 2 ~ 0.2 ‐ 0.3) • Joel Leal, Heather Hamblen, Sarah Flowers, Kaitlyn Sarlo, Mesfin Gobena, Eduardo • Multi‐omics approach can identify genetic pathways for Rodriquez, Zaira Estrada •Adriana Zolini, William Ortiz, Samantha Eifert, Lauren Peacock, Alexa Chiroussot thermotolerance which are independent or positively associated with production performance Increase tolerance to heat stress , while simultaneously Increase tolerance to heat stress , while simultaneously allowing for increased efficiency of production . allowing for increased efficiency of production . 23 24 4

Download Presentation
Download Policy: The content available on the website is offered to you 'AS IS' for your personal information and use only. It cannot be commercialized, licensed, or distributed on other websites without prior consent from the author. To download a presentation, simply click this link. If you encounter any difficulties during the download process, it's possible that the publisher has removed the file from their server.

Recommend


More recommend