case control studies
play

Case-Control Studies n Compare Diseased with Not Diseased on - PowerPoint PPT Presentation

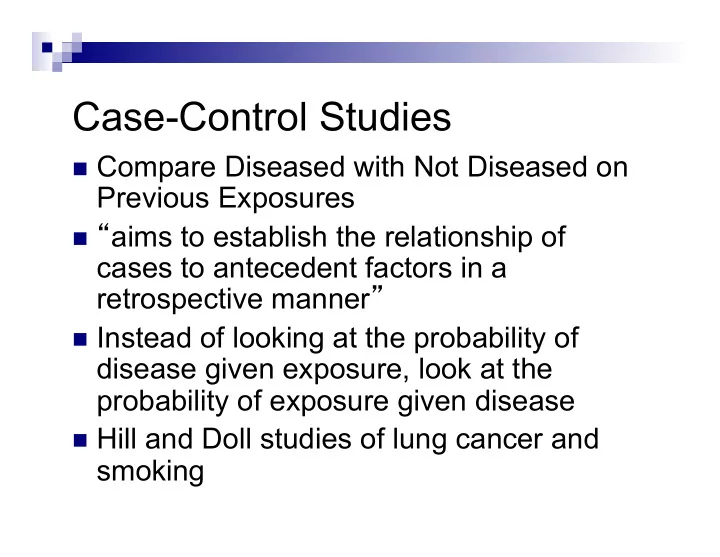
Case-Control Studies n Compare Diseased with Not Diseased on Previous Exposures n aims to establish the relationship of cases to antecedent factors in a retrospective manner n Instead of looking at the probability of disease


  1. Case-Control Studies n Compare Diseased with Not Diseased on Previous Exposures n “ aims to establish the relationship of cases to antecedent factors in a retrospective manner ” n Instead of looking at the probability of disease given exposure, look at the probability of exposure given disease n Hill and Doll studies of lung cancer and smoking

  2. Advantages n Cost n Time n Rare Diseases n Diseases with long latency periods n IDs (CDC)

  3. Disadvantages n Temporality ¨ Did exposure actually precede disease? ¨ Difficult to quantify level of exposure ¨ Better if rapid onset disease n Control Group – crux of the problem ¨ “ the control series is intended to provide an estimate of the exposure rate that would be expected to occur in the cases if there was no association ” ¨ study base “ the most frequently used source of controls is people seeking care at the same (hospital) for other diseases ” n Recall Bias

  4. Anatomy of a Case-Control Study Underlying Cohort

  5. Analysis of Case Control Studies: The Odds Ratio n Prospective vs. Retrospective Approach ¨ Cohort studies: Pr[D|E] e.g. Pr[CA|Smoking] ¨ Case-control: Pr[E|D] e.g. Pr[Smoking|CA] Are they measuring the same thing?

  6. Smoking and Lung Cancer LUNG CANCER SMOKING Yes No Yes 100 900 1000 No 50 1950 2000 150 2850 3000 Pr[D|E] = 100 / 1000 = 0.10 Pr[E|D] = 100 / 150 = 0.66

  7. Need for a New Measure of Effect n Recall: Odds related to Probability (Risk) ¨ Odds = Probability/1 – Probability (And Probability = Odds / 1+ Odds) n 1:1 transformation; W = odds of A occurring, then p= P[A] = W / W +1, e.g. if odds = 2:1, probability = 2/3; if the probability = 0.75 (3/4) then the odds = (3/4) / (1/4) = 3:1 n ODDS = Pr[D] / Pr[d] = Pr[D] / 1 – Pr[D] n ODDS RATIO = Odds in Exposed Odds in Unexposed A way for us to get at risk retrospectively …

  8. Calculating The Odds Ratio D d n OR = ad/bc E 100 900 n Lung CA example, OR = (100) (1950) / (900)(50) = 5.0 e 50 1950 n RR= 100/1000 / 50/2000 = 4.0

  9. Derivation and Invariability of the Odds Ratio n Exposure Odds Ratio (Pr E|D / PrE|d) n P[E | D ] / P[e | D] = P[E | D ] / 1 - P[E | D ] = (a/a+c) / (c/a+c) n P[E|e] = P[E | d] / P[e|d] = (b/b+d) / (d/d+c) n OR = [(a/a+c) / (c/a+c)] / [(b/b+d) / (d/d+c)] = (a/c) / (b/d) = ad/bc n Disease Odds Ratio (Pr [D|E] / Pr[D/e]) n P[E | D ] / P[e | D] = P[E | D ] / 1 - P[E | D ] = (a/a+c) / (c/a+c) n P[E|e] = P[E | d] / P[e|d] = (b/b+d) / (d/d+c) n OR = [(a/a+c) / (c/a+c)] / [(b/b+d) / (d/d+c)] = (a/c) / (b/d) = ad/bc

  10. Rare Disease Assumption n The OR will approximate the RR if the D d disease is “ rare ” E A B n Few people die from D, don ’ t contribute much P-Y to denominator n ‘ a ’ cell small relative to ‘ b ’ ; ‘ c ’ e C D small relative to ‘ d ’ n RR = (a/a+b) / (c/c+d) ~ (a/b) / (c/d) = ad/bc = OR

  11. Cross-Sectional Studies n All there was at time of epidemiologic transition n Exposure and disease ascertained simultaneously; individual level data n Inexpensive and simple n Problems and Biases ¨ Directionality ¨ Incidence – Prevalence Bias n E.g. mouthwash and oral CA ¨ Recall Bias

  12. Evans County, GA. CORNOARY NO TOTAL ARTERY CORONARY DISEASE ARTERY DISEASE PHYSICALLY 14 75 89 ACTIVE NOT 3 87 90 PHYSICALLY ACTIVE TOTAL 17 162 179 Relative Risk = (14/89) / (3/90) = 4.7

  13. Problems and Biases n Directionality ¨ Mouthwash and Oral CA ¨ Hip Fx and Obesity ¨ CAD and Activity n Incidence – Prevalence Bias ¨ More likely to pick up chronic cases ¨ Evans County: CAD Prevalence higher in whites vs. blacks n Recall Bias ¨ Birth defect studies

  14. Ecologic Data vs. Individual- Level Data n A. Ecologic Studies (proportions, percentages) ¨ Advantage – cheap, easy, fast, new hypotheses, to study group-level attributes ¨ Problem – ecologic fallacy n B. The Ecologic Fallacy ¨ Aristotle ’ s “ fallacy of division ¨ “ the assumption that an association at one level of organization can be inferred from that at another ” ¨ “ cross-level ” analysis ¨ E.g. Durkheim, Robinson, Lung Cancer and pollution

  15. We don ’ t know the cells, only the marginals: Disease No Disease Total Exposed ? ? A+B Not ? ? C+D Exposed Total A+C B+D A+B+C+D = total

  16. Ecologic Fallacy n Durkheim ¨ Suicide rates in Prussian provinces strongly correlated to proportion of Protestants (8X ↑ ) ¨ Individual data è risk ↓ to 2X n Robinson ¨ Literacy ¨ r=0.62 areas with many recent immigrants

  17. Design Features of Ecologic Studies ¨ Unit of Analysis the group (often defined geographically) ¨ Data more readily available ¨ Inexpensive, quick, can generate useful hypotheses ¨ Often only way to study group-level variables ¨ Correlations often much higher than those seen in individual-level studies ¨ Does disease occur in exposed? (fallacy)

Download Presentation
Download Policy: The content available on the website is offered to you 'AS IS' for your personal information and use only. It cannot be commercialized, licensed, or distributed on other websites without prior consent from the author. To download a presentation, simply click this link. If you encounter any difficulties during the download process, it's possible that the publisher has removed the file from their server.

Recommend


More recommend