
SLIDE 1
Worksh shop
- p 28./
./29. 29.11. 1.
BalticBoost
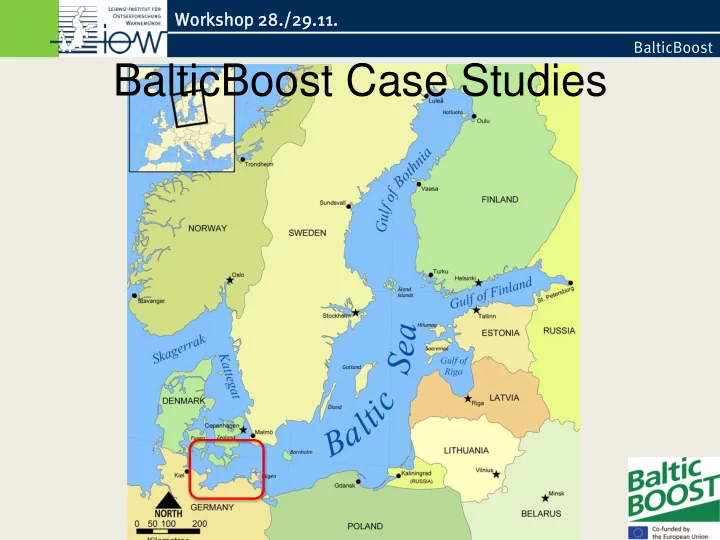
BalticBoost Case Studies Worksh shop op 28./ ./29. 29.11. 1. - - PowerPoint PPT Presentation
Worksh shop op 28./ ./29. 29.11. 1. BalticBoost BalticBoost Case Studies Worksh shop op 28./ ./29. 29.11. 1. BalticBoost Case Studies in MV Human activities Worksh shop op 28./ ./29. 29.11. 1. BalticBoost Case Studies in MV
Worksh shop
./29. 29.11. 1.
BalticBoost
Worksh shop
./29. 29.11. 1.
BalticBoost
Human activities
Worksh shop
./29. 29.11. 1.
BalticBoost
EUSeaMap 2011
Worksh shop
./29. 29.11. 1.
BalticBoost
Worksh shop
./29. 29.11. 1.
BalticBoost
Number Area Percentage Wind Turbines 212 148.400 m² 0,003 % Kables (to shore) Kables (array) 4 4 156 km x 2 m 160 km x 2 m 630.000 m² 0,014 % Kables (data) 2 138 km x 2 m 276.000 m² 0,006 % Mecklenburg Bight 4.606 km² 4.606.000.000 m²
Worksh shop
./29. 29.11. 1.
BalticBoost
EUSeaMap equivalent
Worksh shop
./29. 29.11. 1.
BalticBoost
Worksh shop
./29. 29.11. 1.
BalticBoost
Number Area Percentage Wind Turbines 21 (+1) 14.844 m² 0,0015 % Kables (to shore) Kables (array) 1 1 122 km x 2 m 21 km x 2 m 286.000 m² 0,028 % Kables (data) 4 104,5 km x 2 m 209.000 m² 0,021 % Plantagenet- Grund 1.007 km² 1.007.100.000 m²
Worksh shop
./29. 29.11. 1.
BalticBoost
Worksh shop
./29. 29.11. 1.
BalticBoost
Worksh shop
./29. 29.11. 1.
BalticBoost
Human activities
Worksh shop
./29. 29.11. 1.
BalticBoost
dumping grounds number Area Percentage Point data 5 (2006-08, 2012, 2009, 2010-11, 2006-2013) 125.660 m² 125.660 m² 125.660 m² 196.344 m² 196.344 m² 0,02 % Area data 1 (2010) 1.800.000 m² 0,014 % Mecklenburg Bight 4.606 km² 4.606.000.000 m²
Worksh shop
./29. 29.11. 1.
BalticBoost
Human activities
Worksh shop
./29. 29.11. 1.
BalticBoost
Worksh shop
./29. 29.11. 1.
BalticBoost
Extraction areas Volume
(total/extracted)
Area
(total/extracted)
Percentage Wismargrund
592/560 tm³
93,6/88,6 km² 1,9 % Trollegrund
1.236/356 tm³
7,2/4,1 km² 0,09 % Kühlungsborn
640/150 tm³
6,6/3,1 km² 0,07 % Heiligendamm
1.068/444 tm³
21,5/17,9 km² 0,39 % Mecklenburg Bight 4.606 km² 4.606.000.000 m²
Worksh shop
./29. 29.11. 1.
BalticBoost
EUNIS 3 habitat/ area in MB (km²) Affected by sediment extraction (m²) Affected by dumping (m²) Loss from wind turbines (m²) Affected by cables (m²) Sum (m²)/ percentage sublittoral sand / 1432,7 113.700.000 2.122.004
8,1
sublittoral mud / 2075,4
35.342 401.400 884.406/
0,04
sublittoral mixed sediments/ 72,3
18.400/
0,03
shallow sublit. rock/biogenic reef/ 867,6
270.000 384.508/
0,04
sublittoral till / 4,09
106.800/
2,6
Worksh shop
./29. 29.11. 1.
BalticBoost
EUSeaMap equivalent
Worksh shop
./29. 29.11. 1.
BalticBoost
broad scale habitat area in cs (km²) affected area in cs (km²) percent affected area in cs (km²) (worst case) Percentage (worst case) photic sand 963,36 18,48 1,92 77,76 8,07 aphotic sand 43,74 0,007 0,016 0,007 0,016
Worksh shop
./29. 29.11. 1.
BalticBoost
HELCOM HUB level 6 (Schiele, 2015)
Worksh shop
./29. 29.11. 1.
BalticBoost
habitat, HUB code level 6 area in cs (km²) affected area in cs (km²) percentage mixed bivalves CMM, AA.J3L9 872,1 18,43
mixed bivalves CMM, AB.J3L9 43,6 0,0062 0,01 AA.J3L 16,7 0,0258 0,15 AA.M1C/S 19,1 0,0012 0,01 Mytilidae, AA.J1E1 18,5 AA.J3 13,1 0,0032 0,02 Mya arenaria, AA.J3L4 4,9 0,01 0,18 mixed bivalves CMM, AA.I3L9 1,9 0,0045 0,24 Ophelia/Travisia, AA.J3L11 11,46 0,0066 0,06 AB.M1 0,14 0,0009 0,65 AA.M*1 3,5 AA.G 2,1
1.007 18,49 1,84
Worksh shop
./29. 29.11. 1.
BalticBoost
habitat, HUB code level 6 area in cs (km²) affected area in cs (km²) percentage affected area “worst case” percentage
(“worst case”)
mixed bivalves CMM, AA.J3L9 872,1 18,43
61,90
mixed bivalves CMM, AB.J3L9 43,6 0,0062 0,01 0,006 0,01 AA.J3L 16,7 0,0258 0,15 0,03 0,15 AA.M1C/S 19,1 0,0012 0,01 0,400 2,10 Mytilidae, AA.J1E1 18,5 9,753
AA.J3 13,1 0,0032 0,02 0,003 0,02 Mya arenaria, AA.J3L4 4,9 0,01 0,18 0,01 0,18 mixed bivalves CMM, AA.I3L9 1,9 0,0045 0,24 0,004 0,24 Ophelia/Travisia, AA.J3L11 11,46 0,0066 0,06 5,650
AB.M1 0,14 0,0009 0,65 0,001 0,65 AA.M*1 3,5 0,013 0,36 AA.G 2,1
1.007 18,49 1,84 77,77 7,72
Worksh shop
./29. 29.11. 1.
BalticBoost
Worksh shop
./29. 29.11. 1.
BalticBoost
Worksh shop
./29. 29.11. 1.
BalticBoost
Worksh shop
./29. 29.11. 1.
BalticBoost
Worksh shop
./29. 29.11. 1.
BalticBoost