
SLIDE 1
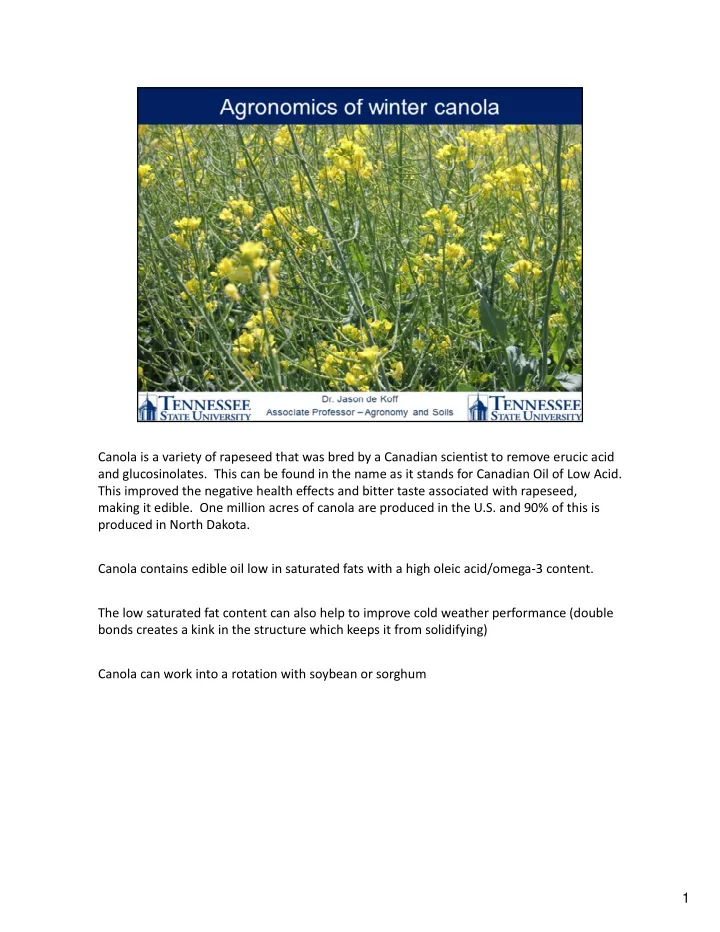
Canola is a variety of rapeseed that was bred by a Canadian scientist to remove erucic acid and glucosinolates. This can be found in the name as it stands for Canadian Oil of Low Acid. This improved the negative health effects and bitter taste associated with rapeseed, making it edible. One million acres of canola are produced in the U.S. and 90% of this is produced in North Dakota. Canola contains edible oil low in saturated fats with a high oleic acid/omega‐3 content. The low saturated fat content can also help to improve cold weather performance (double bonds creates a kink in the structure which keeps it from solidifying) Canola can work into a rotation with soybean or sorghum 1